


Federal order pricing and retail milk prices in this blog are current through April 2022. Data on milk sales is available through February 2022. Flavored milk is included in the charts for whole and two percent milk. Buttermilk is a very small category and is not included in this data.
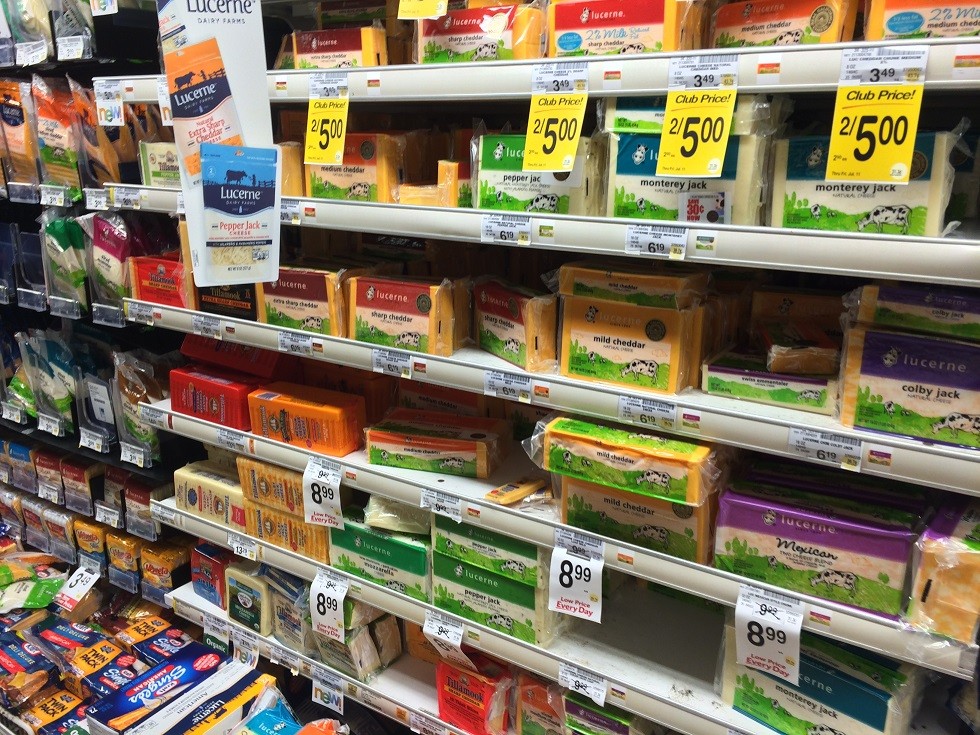
Whole and two percent milk are retail priced identically (Chart I) despite the difference in cost with a different amount of butterfat (Chart II). With butterfat at high prices, whole milk is more expensive to produce than two percent milk. Organic milk makes up only six percent of total beverage milk.
 |
| Chart I – Retail Prices of milk |
 |
| Chart II – Federal Milk Order prices for Whole and two Percent Milk |
Total beverage milk sales continue to decline linearly (Chart IV). That means that the percentage decline is accelerating. In 2018, total milk sales declined by two percent from the previous year. In 2021, total milk sales declined by four percent from the previous year. In 2020, there was a “bubble” caused by the COVID “Stay at Home” policies. It looks like the annual decline of around 80 million pounds per year is returning.
 |
| Chart IV – Total Milk Sales Volume |
Whole milk had a major increase in 2020 as “Stay at Home” policies were implemented (Chart V). Some of this was caused by hoarding as retail milk was in short supply in March 2020 and this influenced the twelve-month averages in Chart V. However, by the start of 2022 whole milk sales have declined to 2019 levels.
 |
|
|
Two percent fat milk sales (Chart VI) follow a linear declining pattern with a small surge at the beginning of COVID policies. It is now back to a linear decline. Two percent milk has declined by 13 percent over the course of Chart VI.
 |
| Chart VI – Sales of Two Percent Fat Milk |
Sales of one percent milk and fat free milk are declining quickly. In February 2018, they made up 23 percent of total milk sales. By February 2022, they made up only 18 percent of total milk.
 |
| Chart VII – Comparison of 2018 and 2022 |
Charts VIII and IX show the decline in one percent milk and fat free milk. One percent milk has declined by 20 percent over the course of Chart VIII and fat free milk has declined by 40 percent over the course of Chart IX.
 |
| Chart VIII – Sales of One Percent Fat Milk |
 |
| Chart IX – Sales of fat Free Milk |
Organic milk saw tremendous growth in 2020, perhaps influenced by the COVID policies of “Stay at Home.” However, that surge is fading as shown in Chart X. Organic milk sales grew by 14 percent in 2020 but in 2021 and 2022 YTD, sales have slide by five percent.
 |
| Chart X – Sales of Organic Milk |
SUMMARY AND CONCLUSIONS
Prices for milk are up, significantly up. Sales of milk are down, and the worst may be yet to come as March and April data becomes available.
Two percent, one percent, and fat free milk are all in a linear decline, meaning that the decrease is becoming a larger percent.
Fat free milk is falling very fast. Less retail shelf space will be used for fat free milk and some private label brands may eliminate fat free milk further escalating the decline in sales. As an ingredient, nonfat dry milk is always an alternative.
Organic milk has started to decrease after a long term of static to increasing volumes.
With these declines, less butterfat will be available for butter churning. See the January 2022 post to this blog for details.