Butter prices as determined by the Agricultural Marketing Service (AMS) are used to price producer butterfat. Recently, butter production has dropped, wholesale disappearance and exports have increased, inventories have tightened, and prices have increased.
When butter prices increase, butterfat prices increase, milk protein prices decrease, and the Class III price is only slightly impacted as covered in this recent post.
USA production of butter was variable in 2020 with the massive changes in eating habits caused by COVID mandates. However, butter production grew nicely overall in 2020 as shown in Chart I. At the start of 2021, monthly butter production peaked. By November of 2021, monthly production was down 26 percent from the start of 2021.
 |
| Chart I – Butter Production 12 Month Moving Averages |
Domestic disappearance from wholesale inventories has grown throughout the span of this analysis and this growth has accelerated in 2021.
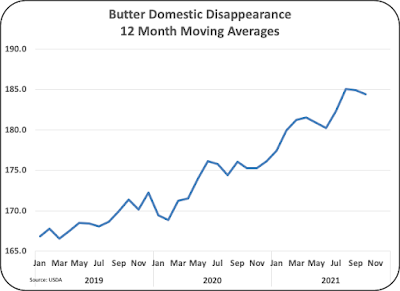 |
| Chart II – Domestic Disappearance 12 Month Moving Averages |
Net exports have remained minimal but are currently positive with an increase in butter exports. The current 12-month average is the first positive 12-month average for net exports since 2015.
 |
| Chart III – Net Exports 12 Month Moving Averages |
With the combination of lower production, strong domestic disappearance, and positive net exports, inventories have decreased, and prices have increased. Chart IV shows the relationship based on 12-month averages. When wholesale supplies decrease, wholesale prices increase. The most recent monthly price of butter is $2.06 per pound.
 |
| Chart IV – Inventories and Prices of Butter |
What is causing this? The explanation will start with where butter is produced. Chart V is a pie chart that shows production by the two biggest butter producing states. California and Pennsylvania butter production are reported over the span of this analysis and all other state butter production is considered too small to report. California produces more than one third of the total U.S. butter, and that butter is shipped throughout the U.S. The percent of the USA butter produced in California has increased from 30 percent at the end of 2018 to 34 percent near the end of 2021.
 |
| Chart V – Butter Production by Location |
Production of butter in California is shown below in Chart VI. There was significant growth in California butter production through 2020, but in 2021, butter production leveled off with almost no growth. This chart is very similar to the Chart I which shows butter production for the U.S. The one big difference is that butter production in California “leveled off” while the USA butter production decreased. Annual butter production in California has grown by 17 percent between 2018 and 2021. By comparison, the annual U.S. butter production has grown by just 10 percent during this same time span.
With Class I milk for drinking and Class III milk for cheese declining in California, the increase in butter churning is offsetting the declines and providing a home for California milk production.
 |
| Chart VI – California Butter Production 12 Month Moving Averages |
Recent press releases have blamed the decreasing butter inventories on logistics and a lack of milk production. The impact of logistics is difficult to analyze, but certainly butter is moved long distances and there is a shortage of drivers for moving products across the USA. Data for milk production is readily available. As shown below, the USA milk production has shown a recent slowdown in growth (Chart VII).
 |
| Chart VII – USA Milk Production 12 Month Moving Averages |
California milk production has followed the USA chart above, except that California milk production grew faster in early 2021 and then abruptly “leveled off.”
 |
| Chart VIII – California Milk Production 12 Mont Moving Averages |
