This post will examine the changes in the use of producer milk brought on by COVID mandates and guidelines.  Five year trends will be addressed on the following products.
Fluid Milk Sales


  • The impact on fluid milk
  • The impact on cheese
  • The impact on ice cream
  • The impact on yogurt
  • The impact on butter
  • The impact on milk production


To prevent the spread of COVID, mandates and guidelines were issued causing lifestyle changes.  The most impactful change was the “stay at home” program.  The “stay at home” program meant that most everyone was buying food from grocery stores and eating at home.  Restaurant business declined.  This change had a major impact on dairy products and consumption. The data is this post are based on 12-month moving averages from 2017 through 2021.
FLUID MILK – Chart I
In the January 2  and January 30 posts, fluid milk was reviewed.  Fluid milk has been on a steady decline for decades.  However, in March 2020, fluid milk sales jumped to 4,242 million pounds an increase of 330 million pounds compared to the prior year.  Grocery shelves were often empty, and processing plants and truckers were stretched to keep up with the demand.  In Chart I below which graphs the 12-month moving averages, there is a black dotted straight line.  It is not a trend line; it simply illustrates the decline over 2017 through 2019 extended to the end of 2021.  Dairy headlines in 2020 were positive because fluid milk sales were increasing, but that “bubble” has largely disappeared by the end of 2021.  The gains were typically attributed to people eating cereal at home with milk.  It appears that the increase of a breakfast of cereal with milk has largely disappeared.  By the end of 2021, milk sales were down, approaching the level as if “stay at home” never happened.
Chart I is based on sales, not production.  Other charts in this post are based on production.  In the case of fluid milk, production and sales are closely linked, due to the short shelf life of fluid milk.
AVvXsEjTWg1vAxlbkk0MQ7v6PmSV0g3m7KGTcyNC6XvL5aaDlfcOTQY3uhFgMaRr JyJOAL6ZLoJqhjKWJka4MuLl4XMmWy0F37Gf7YZSlDRYDEG0Id5yeuq1pUu1TDkVGlmPl SERKNy1 xvVuD0oQyzuTpIGnVy1ZSF hyGFU1ZCjTs1Gv1iwRkJN7n P=w400 h289
Chart I – Fluid Milk Sales

CHEESE – Chart II 

Cheese followed a different route from fluid milk.  When COVID hit and people were discouraged from eating in restaurants and encouraged to “stay at home,” they bought food from grocery stores, not restaurants. Cheese for grocery stores is packaged very differently from cheese packaged for food service sales.  The type of cheese also varies.  This caused a major and immediate impact on cheese processing and distribution.

Cheese production had very nice increases in 2017 and 2018 growing by about three percent annually.  The slowdown in cheese production started in early 2019 and lasted through 2020.   For these two years, the increase in cheese production was only about a half percent annually.  In 2021, production of cheese has again started growing at the same rate as in 2017 and 2018, increasing by about three percent annually.

AVvXsEjLA lJk6HMLYf3XOWA83LUhapQYooo1x O8Hxx8zj5jqFOmuaTAIVFg5ytnKX jMkUG6MTqi13FxqARclnUkq3b0nDSznYiDh2fXwAwcm83m Tr1hEXMrdRCrl2xVNCDVOEfjpnioN YVSkg78t4sdOF3BrQtLqNClvwlLzSAlCYSWRKFkQrUuvEUe=w400 h291
Chart II – Cheese Production
ICE CREAM – Chart III
 
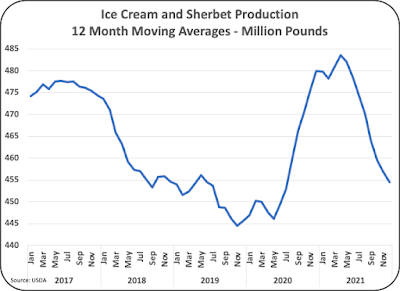
Ice cream production follows the theme that when told to “stay at home,” eating habits change.  Starting in midyear 2020, production of ice cream jumped by eight percent!  This must mean, that when we stay at home, we eat more ice cream!  However, by the end of 2021 most of the gains were gone and the trend is for further reductions.  Ice cream is a major butterfat user so lower ice cream production will require less butterfat, making it available for butter churning.
AVvXsEjlqhi2ftIoEEKLkIiMML6S5Cn6YQ2 K FzWpH7eKxIaOQ3tR74AdDpd4XoM0P406VfdiBLczfvjMozYSJoBzjVqD3pVU9i7uiA3LjAi2f92NPCECn5tsYn2x RFSA FyS5fgDvV9s ecqL8EkkPfjR l33NYIcnqkJgeVc56inzjpUHrLhPb C90OB=w400 h291
Chart III – Ice Cream and Sherbet Production
YOGURT – Chart IV
After years of significant growth, yogurt was in a decline by 2017.  As COVID and “stay at home” emerged in March of 2020, sales reversed and instead of a decline, yogurt production grew by 11 percent between March 2020 and the end of 2021.  Unlike ice cream, yogurt production has continued to grow through 2021.  It appears that COVID forced more trial of yogurt and has changed consumer habits, at least temporarily.
Because much of yogurt is reduced fat or no fat, yogurt does contribute to the pool of butterfat for other products like butter and ice cream.  However, the impact is small compared to the amount of butterfat harvested from fluid milk.  (See the January 30 post to this blog for more details on butterfat removed from fluid milk.)
AVvXsEixLn1KqMEGDFWX2T cuiGuKBYZvnjcwejFxUl9yjuoCxoHJKM1D7GSbRaV1e5T75rJ4zExnYKBbrXVaNclSsuikcXzJhCnN4In9IJcNn4 AZFxop6wv4DK8PGR7X33yGQzv xW6RSqHN4iKELa7O5jqCvKFBQDgUAmJ Oim4 AivTiOXavTr2HIOAT=w400 h291
Chart IV – Yogurt Production
BUTTER – Chart V
Butter production is a little confusing.  From 2017 through early 2020, butter production was growing at a little over one percent annually.  When COVID “stay at home” policies were implemented, butter production grew by nine percent in one year.  Since then, production has decreased noticeably.  From March of 2021 to December of 2021, butter production dropped by over three percent.  Is this just a “return to normal?”  Probably
The data suggests that when we stay home, we eat more butter.  Once the impact of COVID declined, the consumption of butter declined.  This is contrary to the what has been in the press and in this prior blog post, stating that butter production had decreased due to a lack of milk and logistic issues.  By comparison, there was a significant increase and no drop in cheese production in 2021.
AVvXsEhiX3k9My9VrWt7R5hJvEobDyhATLDJJyLr uKK1b3BDmawmdmcR5aolyZJEjndijIu6gytbUzZE0l6VlCo01u meS4TT8oS l7AoszvCpR i13KRRSHU0w78uRy2z4td3 qN ryTwFLDki2Hu PRGcvAu45uVo9p18KPW55Ry2vuBBVcsQL8GpClh=w400 h289
Chart V – Butter Production
PRODUCER MILK PRODUCTION – ChartVI
 
From the start of 2017 to March of 2020, milk production was growing at just over one percent annually.  For the next 12 months, starting in March 2020 milk production grew by over 1.5 percent.  In the last half of 2021, milk production has plateaued.  Is this just another return to normal?
AVvXsEjv6g9v4TJ9 WoTu5OflSY69VHiZb9i95wPrGc4c6 meITh42yQWh6xOkN7oa8vwgX42oFdReEpWopFnmZqYK8S7KImnf8A8lKmG0 BZdn0ic9JwTBxPlzQNRvIWg00nzVukJCo6W93jvjQFOrZMJuRf5UP3o4rMvrfGYZyOa v5tp0FuI Lrgu7Zg4=w400 h291
Chart VI – Milk Production


WHAT DOES ALL THIS SAY?

COVID and “stay at home” had a significant impact on the dairy industry by every metric explored in this post.  COVID did not end in March of 2021, one year after the start, but dairy statistics indicate that eating habits and dairy consumption headed back to near normal.  The only statistic that seems to have retained the COVID impact is yogurt, and that category is very small compared to overall dairy statistics.

Farmers up pressure on French government.

You may be interested in

Related
notes

Most Read

Featured

Join to

Follow us

SUBSCRIBE TO OUR NEWSLETTER