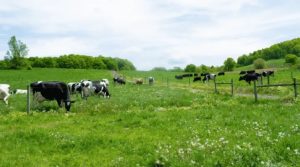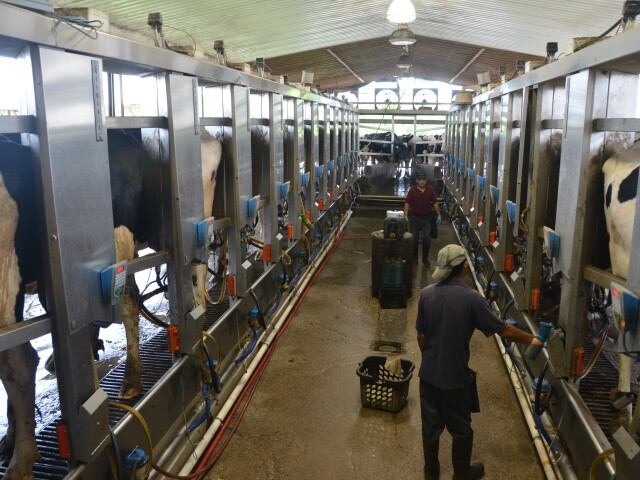


Milk Production: Milk production in the 23 major states during April totaled 17.4 billion pounds, up 0.3% from April 2018. Production per cow for April averaged 1,996 pounds. The number of milk cows was 8.71 million head, 1,000 head less than March 2019. March production was revised down 0.2% from preliminary estimates. For milk production in the top 5 producing states, California was up 2.6% from April a year ago; Wisconsin up 0.4%; Idaho up 2.2%; New York up 1.9%; and Texas up 6.7%. Other states with large production increases were Colorado (3.7%), South Dakota (1.8%), and Vermont (1.8%). The states reporting a large decline in production compared to April 2018 were Virginia (-11.0%), Illinois (-9.6%), Pennsylvania (-7.1), Florida (-5.5%), Ohio (-5.4%), and Arizona (-4.7%).
Milk Price and Utilization: The Southeast Uniform milk price for April was $18.70, no change from March and $1.82 higher than April 2018. The Appalachian Uniform milk price was $18.28, down $0.03 from March and $1.72 higher than April 2018. April’s Class III price was $15.96, up $0.92 from March, and $1.49 higher than April a year ago. The Class IV price was up $0.01 from March to $15.72, and $2.24 higher than April 2018. The Class I Mover price for June is $17.07, up $0.65 from May. The milk/feed ratio for April was 2.11, 0.03 lower than March.
Milk Price and Utilization: The Southeast Uniform milk price for April was $18.70, no change from March and $1.82 higher than April 2018. The Appalachian Uniform milk price was $18.28, down $0.03 from March and $1.72 higher than April 2018. April’s Class III price was $15.96, up $0.92 from March, and $1.49 higher than April a year ago. The Class IV price was up $0.01 from March to $15.72, and $2.24 higher than April 2018. The Class I Mover price for June is $17.07, up $0.65 from May. The milk/feed ratio for April was 2.11, 0.03 lower than March.
Southeast Class I utilization was 67.16%, up 2.46% from March, and 2.14% higher than April a year ago. The Uniform butterfat price was $2.5622, down 0.72 cents from last month and 6.78 cents higher than April 2018. The April Class I price was $19.56. May Class I price is $20.22. Appalachian Class I utilization was 66.12%, up 1.43% from March, and 0.32% higher than April a year ago. The Uniform butterfat price was $2.5610, down 0.70 cents from last month and 6.53 cents higher than April 2019. The April Class I price was $19.16.
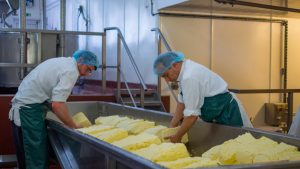
Cheese Production and Stocks: Total cheese production in March was 1.10 billion pounds, down 0.7% from a year ago while butter production was down 3.9% to 175 million pounds. Nonfat dry milk (NDM) production was down 8.0% compared to a year ago with total production at 164 million pounds while skim milk powder (SMP) production was up 17.9% to 49.6 million pounds compared to a year ago. Total cheese stocks at the end of April were up 4% from April a year ago and up 1% from the previous month while butter stocks were up 8% from last month and down 5% from a year ago.
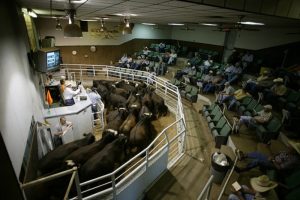
Springer Prices and Cow Slaughter: At Smiths Grove, Kentucky on May 28, supreme springers were not tested and US approved springers brought $1,100, up $50 from last month. Dairy cow slaughter in April was 268,500 head, down 33,900 head from March and 21,600 more than April 2018.
Cheese Production and Stocks: Total cheese production in March was 1.10 billion pounds, down 0.7% from a year ago while butter production was down 3.9% to 175 million pounds. Nonfat dry milk (NDM) production was down 8.0% compared to a year ago with total production at 164 million pounds while skim milk powder (SMP) production was up 17.9% to 49.6 million pounds compared to a year ago. Total cheese stocks at the end of April were up 4% from April a year ago and up 1% from the previous month while butter stocks were up 8% from last month and down 5% from a year ago.
Springer Prices and Cow Slaughter: At Smiths Grove, Kentucky on May 28, supreme springers were not tested and US approved springers brought $1,100, up $50 from last month. Dairy cow slaughter in April was 268,500 head, down 33,900 head from March and 21,600 more than April 2018.
| Southeast Federal Order Prices | ||||||
| Month | Uniform Price $/cwt. | Class I Price $/cwt. | Class III Price $/cwt. | Class IV Price $/cwt. | Class I % Utilization |
Butterfat Price $/lb. |
| Nov 18 | 18.71 | 19.32 | 14.44 | 15.06 | 78.39 | 2.5651 |
| Dec 18 | 18.00 | 18.85 | 13.78 | 15.09 | 70.02 | 2.5328 |
| Jan 19 | 18.27 | 18.92 | 13.96 | 15.48 | 75.94 | 2.5249 |
| Feb 19 | 18.35 | 19.10 | 13.89 | 15.86 | 70.33 | 2.5348 |
| Mar 19 | 18.70 | 19.78 | 15.04 | 15.71 | 64.70 | 2.5694 |
| Apr 19 | 18.70 | 19.56 | 15.96 | 15.72 | 67.16 | 2.5622 |
| Appalachian Federal Order Prices | ||||||
| Month | Uniform Price $/cwt. | Class I Price $/cwt. | Class III Price $/cwt. | Class IV Price $/cwt. | Class I % Utilization |
Butterfat Price $/lb. |
| Nov 18 | 18.12 | 18.92 | 14.44 | 15.06 | 74.77 | 2.5635 |
| Dec 18 | 17.45 | 18.45 | 13.78 | 15.09 | 66.57 | 2.5311 |
| Jan 19 | 17.82 | 18.52 | 13.96 | 15.48 | 75.83 | 2.5240 |
| Feb 19 | 18.00 | 18.70 | 13.89 | 15.86 | 72.11 | 2.5356 |
| Mar 19 | 18.31 | 19.38 | 15.04 | 15.71 | 64.69 | 2.5680 |
| Apr 19 | 18.28 | 19.16 | 15.96 | 15.72 | 66.12 | 2.5610 |
What is the Market Offering for Milk to be Sold in August?
Ex: It is May 30 and Aug. Class III milk futures are trading at $16.70. Local Aug. basis estimate is +$3.00.

You may be interested in
- Topics |
- Colorado, CWT, Dairy prices, Kentucky, Milk, South Dakota
Legal notice about Intellectual Property in digital contents. All information contained in these pages that is NOT owned by eDairy News and is NOT considered “public domain” by legal regulations, are registered trademarks of their respective owners and recognized by our company as such. The publication on the eDairy News website is made for the purpose of gathering information, respecting the rules contained in the Berne Convention for the Protection of Literary and Artistic Works; in Law 11.723 and other applicable rules. Any claim arising from the information contained in the eDairy News website shall be subject to the jurisdiction of the Ordinary Courts of the First Judicial District of the Province of Córdoba, Argentina, with seat in the City of Córdoba, excluding any other jurisdiction, including the Federal.