California became a Federal Milk Marketing Order in November of 2018. With that came many changes. With the change to a Federal Order came a new pricing system that paid for milk protein specifically. It also brought a change allowing de-pooling for all milk except beverage milk.
The de-pooling began immediately after California became a Federal Order. A Producer Price Differential (PPD) levels the value of all Classes of milk to a Uniform or average price for all. When the Uniform price is less than the first payment based on Class III prices, the PPD will become negative. De-pooling brought the opportunity to avoid a negative PPD when it is advantageous.
In May of 2019, the formula for pricing Class I beverage milk was changed. That change has had a great impact on the California Federal Order.
The interactions of the pricing formulas and processes are complicated. However, understanding the elements of payment is very important in order to develop a program that will maximize revenue and cash flow for a producer. Some of the elements in maximizing revenue are directly related to the actions of the producer. Other elements result from items not under the control of the producer.
When a producer delivers milk through his “handler,” the milk is analyzed for component levels and quality. This quantity of the components is directly under the control of the individual producer. The producer is paid nothing for the water in his milk. He is paid only for the three components in the milk; butterfat, milk protein, and “other solids”. The milk that is delivered is tested for component levels and paid at the announced monthly prices at the end of the month. The check is based on pounds of milk protein, pounds of butterfat, and pounds of “other solids.” The prices paid are based on the Federal Orders prices for all producers in the U.S. that are in a Federal Order.
The revenue paid for components is based on the pounds delivered for each individual producer. The standardized Class III price is based on three percent protein, 3.5 percent butterfat, and 5.7 percent “other solids.” The Class III price is an index and is not what the producer is paid! He is paid based on his actual levels of components in his milk. This is true for all producers paid on the Class and Component pricing in the U.S.
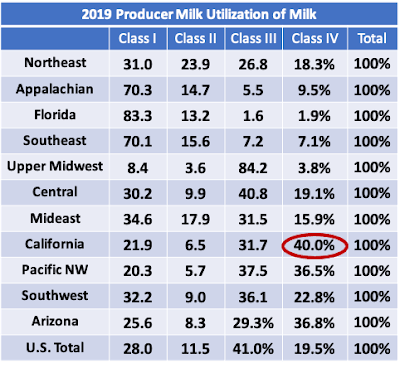
What makes California different from other Federal Orders is the calculation of the Uniform price and the PPD. As mentioned above, the Uniform price is the weighted average of all milk that is pooled. The weighted average Uniform price is different in each Federal Order because of the mix of the four Classes of milk is different in each Federal Order. Class IV milk is typically the lowest paid milk (Table I) and California makes a lot of it (Table II). (The Class I price in Table I is based on the base Class I price. The Federal Orders pay an additional amount to encourage Class I availability. As an example, in the month of September 2020, the Class I differential brought the California Class I price to $20.54 per cwt. while the base price was $18.44 per cwt.)
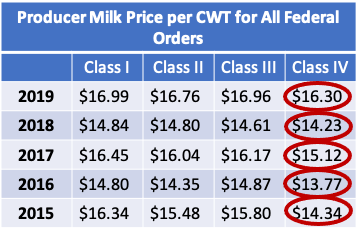
As shown in Table II, in California, 40 percent of the milk included in the Federal Order is Class IV milk, the lowest paid Class. That is double the overall average of all FMMOs which is 19.5%. Class I milk, the highest paid, at 21.9 percent is near the bottom of all Federal Orders. This mix of milk Classes with a lot of the lowest paid milk makes it easy to generate a negative PPD.
Class IV skim is priced based on the price of Nonfat Dry Milk (NDM). NDM is mostly exported and California is geographically positioned to be a low-cost provider to Mexico and other destinations touching the Pacific Ocean. The price of NDM is dependent on the international supply and demand.
The Class I formula was changed on May 2019, seven months after California became an FMMO. NDM prices are now consistently part of the basis for Class I skim milk prices. Based on the mix in Table II, 62% of the California milk is now priced based at least partially on the value of NDM. For more details on the formula change, see the October 11, 2020 post to this blog.
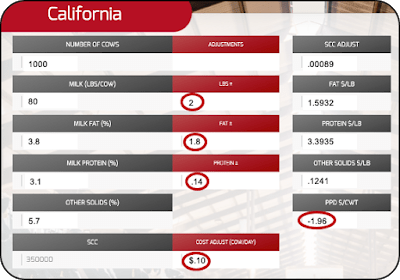
Below are scenarios showing the impact of amino acid balancing which increases components. In the first scenario, the PPD is set at zero. In the second example, the September California PPD of a negative $1.96 per cwt. was included. In both examples below the FMMO prices for September 2020 are used.
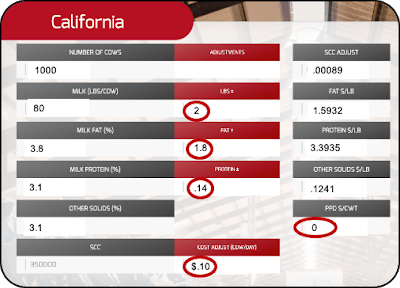
The scenarios below were based on a herd of 1000 cows producing 80 pounds of milk per cow per day with butterfat levels of 3.8 percent and milk protein of 3.1 percent. The impact of amino acid balancing was based on an increase of two pounds of milk per cow per day, an increase in butterfat content of 1.8 percent, and an increase in milk protein of 1.4 percent. A 10 cent per cow per day increase in feed cost to balance for amino acids was used. Based on individual situations the costs and increases in productivity will be different.
Both scenarios were evaluated using the website milkpay.com. The functionality is available in apps for iPads, iPhones, and Android devices as well as the web format.
SCENARIO A
Chart I shows the parameters used for Scenario A. The PPD is set at zero and the increases for amino acid balancing are as defined above.
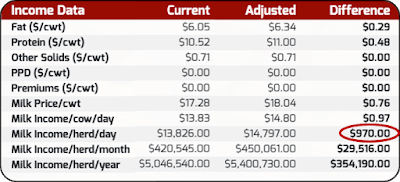
The results for Scenario A are shown below in Chart II. For this case, amino acid balancing will increase revenue by $354,190 annually for this herd.
SCENARIO B
In Scenario B, the same cost and production increases used in Scenario A were used and the California PPD for September 2020 was added. It was a negative $1.96 per cwt.
The results changed as shown in Chart IV. The negative PPD has a significant impact on the pay per cwt., but the increased revenue from amino acid balancing was only slightly impacted, reducing the increased revenue in Scenario A from $354,190 annually to $339, 882 annually in Scenario B.
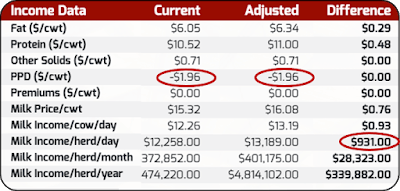
with a negative PPD
WHAT DOES ALL THIS MEAN?
May things have changed in the milk payment methods for California over the last 2 years. Although not mentioned above, the quota payment system which is unique to California is also a significant element of milk payment.
One of the most major changes for California as a FMMO was the specific payment for milk protein. The numbers in the above scenarios are based on component prices for September 2020. Milk protein in September was valued at $3.39 per pound. October numbers were just announced and milk protein for October is $5.01 per pound.
While each producer’s calculations must be specific to his own operation, there is very little doubt that balancing for amino acids is a way to increase revenue and cash flow. While the calculations and the payment system are complex, the milkpay app can simplify the evaluation process. Running a business by precise numbers is the routine business process. Running a dairy operation is no different.
