This post will update the status of the commodities that are used for or influence pricing of producer milk. It will cover the following:
. Cheese production and inventories are very important as they are key in determining the price of cheese and in turn, the Class I and Class III skim milk prices and the value of milk protein.
. Butter production and inventories are very important as they are key in determining the value of butterfat in milk.
. Nonfat Dry Milk (NDM) determines the Class II and the Class IV skim milk prices and half of the Class I skim price. The combined impact of NDM is very significant.
. Dry Whey production and inventories are key in determining the value of dry whey and in turn, the price of “other solids” for Class III pricing.
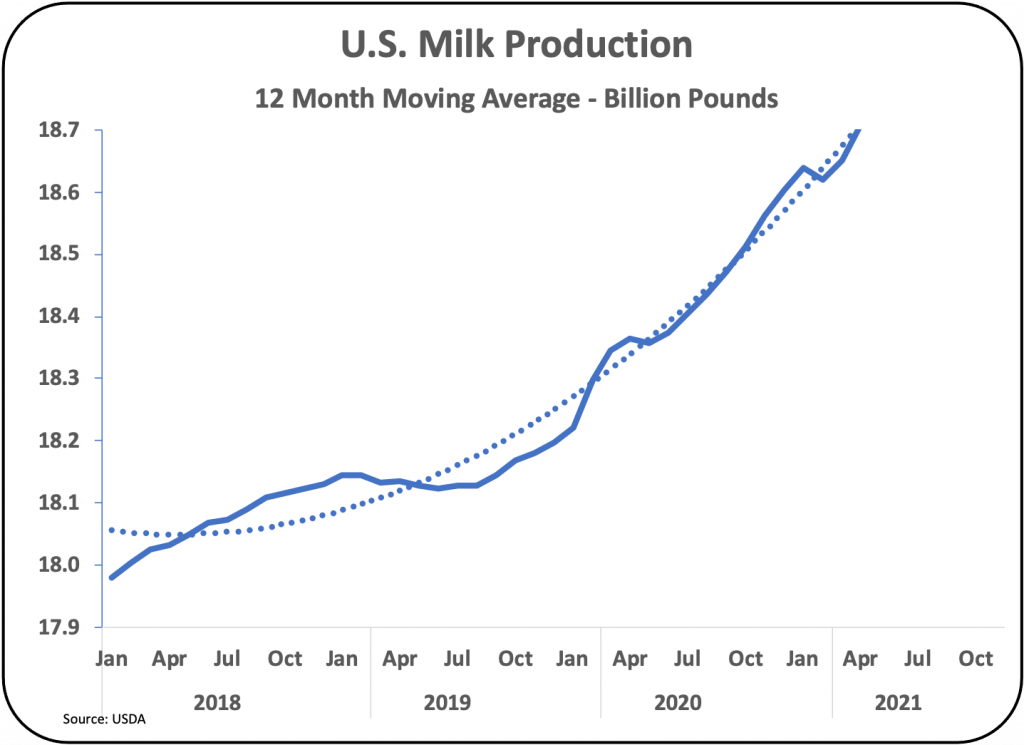
. Milk production is key to determining the future pricing of cheese and butter. When milk is plentiful, commodity inventories will swell, and prices will be lower. This post will start with the most recent data on milk production. The growth of milk production is a leading indicator of producer milk prices and currently it is the most troubling parameter for producer milk prices.
Milk production is reaching record levels. Chart I graphically shows the increase based on 12-month moving averages. While the 12-month moving averages are best for seeing long-term trends, the most recent monthly increases in milk production are indicators of how robust milk production is currently. For the last two months the increases vs. the prior year were 3.5 percent and 4.6 percent respectively. These increases are well above the needed supply of milk to match domestic consumption and exports. Excess milk is often used for cheese as the cheese can be stored for a longer time. This can inflate cheese inventories and lower prices.

The price of cheese, as determined by Agricultural Marketing Service (AMS), is based on the price paid for young (up to 30 days old) Cheddar cheese. The monthly production of Cheddar cheese is public, and the current 12-month averages and trends are shown in Chart II. In May 2020, one year ago, the 12-month moving average increase in production of Cheddar vs. the prior year was .3 percent. In May of 2021, the most recent data, the 12-month moving average increase is three percent.

The inventory level of young Cheddar cheese is not available publicly. However, the inventory of “American” cheese is available publicly and Cheddar cheese makes up 70 percent of “American” cheese production. Chart III shows the current trends in “American” cheese cold storage inventories. The numbers in Chart III are based on the National Agricultural Statistics Service and other sources of inventories and includes all “American” cheeses regardless of age. The 12-month moving average of “American” cheese inventories has grown by just three percent over the last 12-months.
In January of 2019, when inventories levels were near the current levels, the price of cheese as published by AMS was $1.54 per pound. In May 2021 inventories are nearly the same, but the AMS price of cheese is $1.82 per pound. It is no wonder that in June, the AMS price of cheese dropped to $1.64 per pound. Currently, the NASS weekly survey numbers for cheese are falling to a level near $1.50 per pound.

Butter inventories are growing and have been for over a year. Chart IV displays the size of the inventory expressed as 12-month moving averages. In the last year and a half, the 12-month moving average of butter inventories have grown by 30 percent.

Net exports of butter have in the past been negative as more butter was imported than exported. However, in the last six months, with more inventory available, exports have increased, and imports have decreased. As a result, net exports are now slightly positive. However, net exports are still less than one percent of total disappearance. Domestic disappearance is key.
Butter production has fallen in the last two months but is still higher than domestic disappearance (Chart V). This means that inventories are still growing, but at a slower rate.

With the increase in butter inventories, the price of butter has fallen from the 2018 and 2019 record levels of $2.39 per pound. In February 2021, butter prices were at $1.36 per pound. In the last three months there has been increases in butter prices with June at $1.79 per pound. The most recent weekly AMS prices have remained at the June 2021 levels. But with rising inventories, prices will likely begin to fall in the near future.

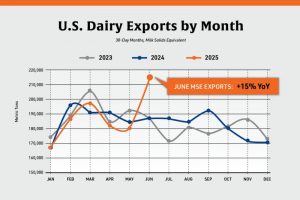
NDM pricing has become very important as it prices both Class II and Class IV skim milk and half of the pricing of Class I skim milk. With increased butter production, more NDM is available. It is being increasingly exported (Charts VII) and, therefore, the AMS price for NDM is based primarily on international competition. Currently, 70 percent of NDM is exported and it appears to be steadily rising. International markets can be very volatile.

The 2021 increases in NDM prices are very positive for producer milk pricing. The lowest 2020 NDM price was $.85 per pound and the June 2021 price is $1.27 per pound, a 50 percent increase.
The higher NDM price is positive for Class II and Class IV milk prices, and partially for Class I milk prices. The May 2019 change in the Class I pricing formula change is finally positive. The old Class I formula would calculate the July skim milk price at $10.59 per cwt., as opposed to the new formula which calculated the price at $10.95 per cwt.
As mentioned above, international dairy product sales and prices can be very volatile.
Dry whey inventories are very stable (Chart VIII). If there is not a ready market for dry whey, typically, it will not be dried.

Dry whey has maintained a balance between domestic and export use favoring domestic use. However, beginning in early 2021, there has been an increase in exports and a decrease in domestic use. Exports now account for 60 percent of dry whey disappearance (Chart IX). This increases the impact of dry whey pricing as determined by international competition.

Dry whey prices hit a low of $.32 per pound in 2020, but have now increased to $.64 per pound, a 100 percent increase. International pricing can be volatile, but for now the current price is providing producer revenue with a higher value of “other solids.”
In summary, producer milk pricing is becoming increasingly dependent on international pricing factors for NDM and dry whey. Producer milk prices have always been volatile, but the increasing dependence on international markets will increase this volatility.
When producer finances allow, cow and milk production increases. The increase in milk production is not demand driven. As a result, milk production grows, prices fall, and then production levels come back in line. It appears that milk production is entering this cycle.
