U.S. per capita consumption of fluid cow’s milk has been decreasing for over 70 years. During the previous decade, it fell at a faster rate than it did during each of the previous six decades. USDA, Economic Research Service (ERS) data show that the average rate of decrease was 1.0 percent per year over the 2000s. During the 2010s, it was 2.6 percent per year.
About 90 percent of the U.S. population does not consume enough dairy products to meet Federal dietary recommendations, and declining per capita consumption of fluid cow’s milk prevents these individuals from consuming a diet more line in with those recommendations. According to the Federal Dietary Guidelines for Americans, 2020–2025, children aged 2 through 10 years should consume 2 to 3 cup-equivalents of dairy products per day (with specific quantities based on age, gender, and level of physical activity). Individuals older than age 10 should consume 3 cup-equivalents. Consuming 1 cup of cow’s milk, 1 cup of fortified soy beverage, 1 cup of yogurt, 1.5 ounces of natural cheese, or 2 ounces of processed cheese contributes 1 cup-equivalent toward meeting daily dairy recommendations. Although U.S. per capita consumption of cheese and yogurt increased threefold since 1970, trends in fluid cow’s milk consumption prevent overall dairy intake from rising much above 1.5 cup-equivalents per person per day.
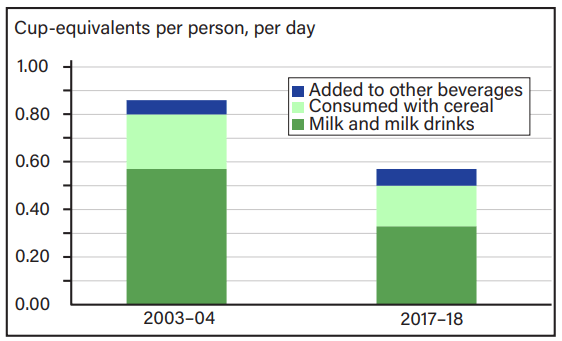
Using data collected between 2003 and 2018 through the National Health and Nutrition Examination Surveys (NHANES), we disaggregate trends in U.S. fluid cow’s milk consumption into changes over time in the amounts that individuals drank as milk and in milk drinks, poured into cereal, and added to other types of beverages like tea and coffee. We also investigate each of these trends separately for children, teenagers, and adults.
What Did the Study Find?
Drinking is the primary way that people consume fluid cow’s milk. Defining this type of usage to include drinking plain and flavored milk as well as malted milk, eggnog, kefir, hot chocolate, and other milk-based beverages, we found:
• In 2003–04, individuals drank about 0.57 cup-equivalents of milk and milk drinks per person, per day. That number fell to 0.53 cup-equivalents in 2009–10 and to 0.33 cup-equivalents in 2017–18.
• Consumption was down among children, teenagers, and adults. Another way people consume fluid cow’s milk is by pouring it into cold or hot cereal. We found:
• In 2003–04, individuals used about 0.23 cup-equivalents of milk in cereal per person, per day. That number fell to 0.21 cup-equivalents in 2009–10 and to 0.17 cup-equivalents in 2017–18.
• Per capita milk consumption with cereal was down primarily among children.
A third way that people consume fluid cow’s milk is by adding it to other types of beverages like coffee and tea. In 2017–18, individuals consumed about 0.07 cup-equivalents per person per day this way, about the same amount as in 2003–04.
Many factors contribute to declining fluid cow’s milk consumption, including demographic and generational changes in the U.S. population. Younger generations who grew up drinking less milk as children appear to consume less at all ages. However, even after accounting for demographic and generational changes, there is still a downward trend in consumption over the survey period. This decrease appears to reflect changes in the competitiveness of cow’s milk compared to other beverages at retail stores, as well as the competitiveness of cereal compared to other breakfast options.
How Was the Study Conducted?
Milk consumption was measured using dietary recall data collected through the National Health and Nutrition Examination Surveys (NHANES), an ongoing, nationally representative U.S. survey designed to assess health and nutritional status. For the study, we pooled consumer data from eight survey cycles: 2003–04, 2005–06, 2007–08, 2009–10, 2011–12, 2013–14, 2015–16, and 2017–18. We examined consumption by children (ages 12 and under), teenagers (ages 13 through 19), and adults (ages 20 and older). Statistical models were also estimated for each age group to separate consumption trends associated with demographic and generational change from those most likely associated with other factors.
For the full report, Examining the Decline in U.S. Per Capita Consumption of Fluid Cow’s Milk, 2003–18, please click here. https://www.ers.usda.gov/webdocs/publications/102447/err-300.pdf?v=2595
–Hayden Stewart, Fred Kuchler, Diansheng Dong, and Jerry Cessna
USDA Economic Research Service
