Almost 800 dairies have closed in Wisconsin in the past 12 months, which sounds bad. Over the past 75 years, though, the state has been losing dairies at an average rate of more than 2,000 a year. It has only about one-quarter as many dairy farms as it did just 25 years ago. In other words, dairies shutting down in Wisconsin is not some new thing.
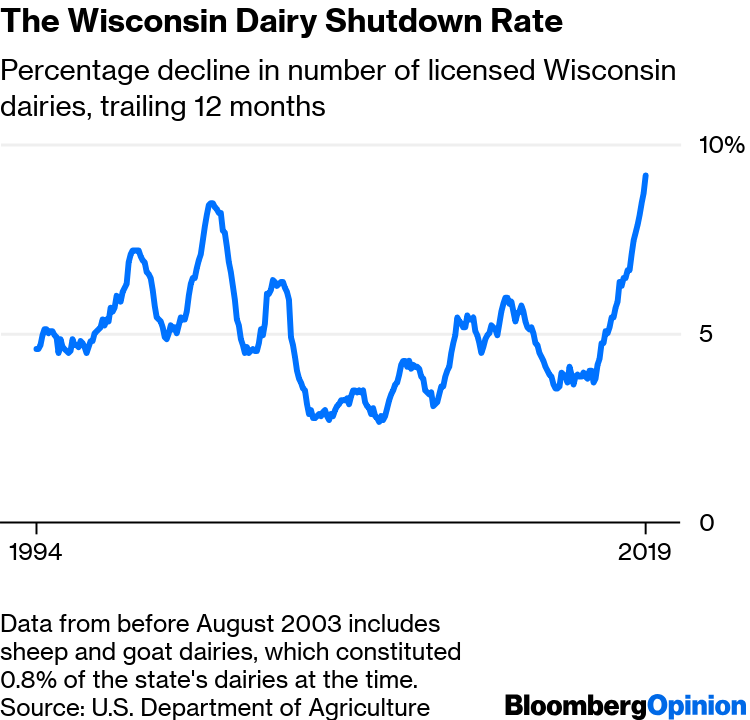
Data from before August 2003 includes sheep and goat dairies, which constituted 0.8% of the state’s dairies at the time.
As is clear from the above chart, the percentage losses have increased sharply over the past two years. The nationwide rate of dairy closings, while not available on a monthly basis and usually not as high as the Wisconsin rate, also jumped to 6.9% in 2018 from 3.9% the year before (and a compound annual rate of 3.8% over the previous decade), so talk of a dairy crisis in Wisconsin and elsewhere — and the role that oat-milk drinkers and President Donald Trump’s tariff wars may be playing in it — is not unwarranted. Still, this crisis has to be understood within the context of a dairy industry that has been consolidating for more than a century.
As of the end of last year, there were 37,468 licensed dairies 1 nationwide, and 8,500 in Wisconsin, more than any other state. Wisconsin appears to have held the most-dairies title since the 1950s. 2 It became the biggest milk producer in the 1910s, passing New York, but fell behind California in the early 1990s. Over the past decade, interestingly enough, it has been catching up.
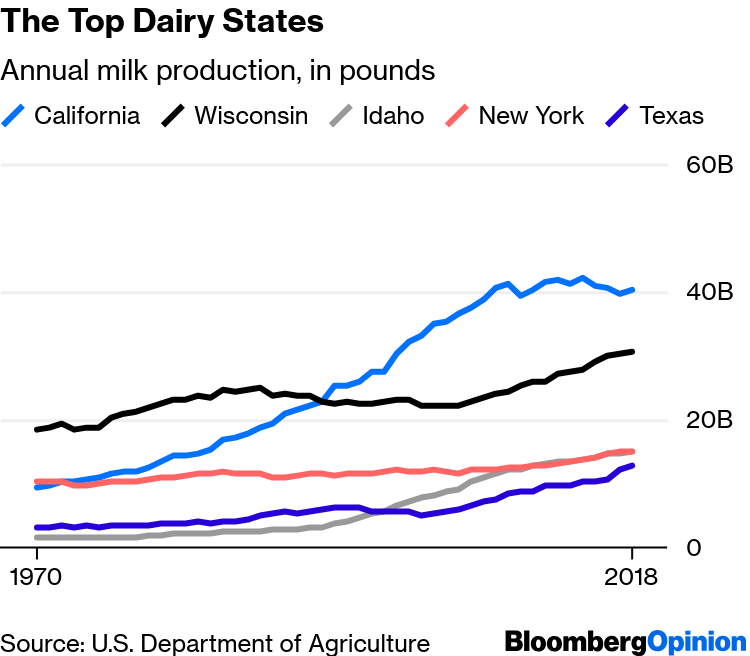
California’s rise to the top in dairying was the work of a relatively small number of dairy farms that were much bigger than those in Wisconsin and elsewhere in the Midwest, South and East. The state’s mild, mostly arid climate allowed for larger herds than were then manageable in more humid, bovine-disease-prone regions, and its abundant alfalfa (which grows year-round there and thus produces more than twice the national average yield per acre) made it easy to feed them. Meanwhile, spectacular population growth, from 7 million people in 1940 to almost 30 million in 1990, coupled with long distance from traditional dairying regions that made bringing milk in from elsewhere expensive, necessitated a rapid ramp-up in milk production that favored bigger operations. By 1959, while it only had about one-fifth as many dairies overall as Wisconsin, California had more dairies of 200 cows or more than all the other states combined.
These cows also produced more milk, on a per-cow basis, than their peers in other states. The U.S. Department of Agriculture’s annual pounds-of-milk-per-cow statistics, which are available starting from 1970, 3 show California’s bovines in first place every year through 1982. By then, California-style dairying had spread to other Western states: Washington took the productivity lead in 1983, and over the next three decades battled it out with Arizona, California, Colorado and New Mexico for the top spot.
In 2017, though, Michigan’s cows wrested it away. They held on to their No. 1 ranking in 2018, at 26,340 pounds of milk per cow, and Wisconsin, Nebraska, Iowa, New York and Kansas all had per-cow yields higher than California’s 23,306 pounds. This was partly due to a dairy exodus from California: Encroaching residential development has all but extinguished the industry in its former Southern California heartland of Riverside and San Bernardino counties, and environmental regulations now make it tough to open new dairies elsewhere in the state. As a result, California dairy farmers have been emigrating to other Western states for a while now, and lately some have opted for the Midwest, thanks to advances in ventilation techniques that have enabled the construction of indoor, California-scale dairy operations in less temperate climes (I wrote about this phenomenon last fall, while Esquire’s Ryan Lizza told the story of one particularly noteworthy former California dairy farmer — U.S. Representative Devin Nunes — whose family has shifted its operations to Iowa).
Still, most of the big new dairies in Michigan, Wisconsin, Nebraska, Iowa and the like are run not by California transplants but by locals who decided they had to get bigger to survive. In Wisconsin, the shock of losing the status of top dairy state also seems to have been a motivating factor. The nationwide trend toward bigness is quite apparent from the Census of Agriculture conducted every five years: In the 2017 edition, dairy herds of 1,000 head or more for the first time accounted for more than half the nation’s milk cows, up from 10% in 1992.
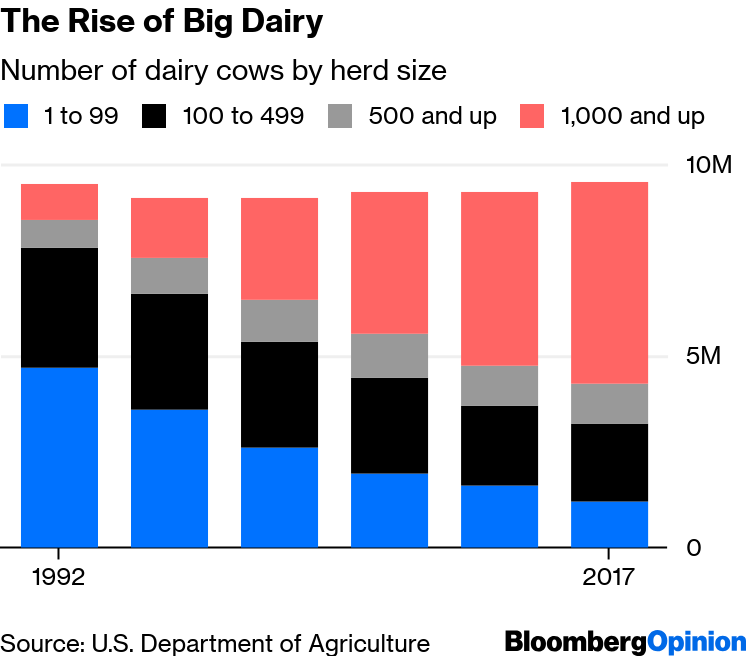
Not coincidentally, while 2017’s total milk cow count of 9.5 million was little changed from 1993, milk production rose 44% over that period. Since the 1920s, the number of milk cows in the U.S. has fallen by more than 50%, and production has more than doubled. Bigger dairies aren’t always more productive on a per-cow basis than smaller ones, but they tend in that direction: A report from the University of Wisconsin’s Center for Dairy Profitability based on 2014-2016 production data from 251 Wisconsin dairy farms found that annual milk production per cow averaged 19,445 pounds at farms with one to 49 cows and 26,916 pounds at those with 500 to 999 cows. The report didn’t include production data for Wisconsin farms even bigger than that, but it did have information on their profitability:
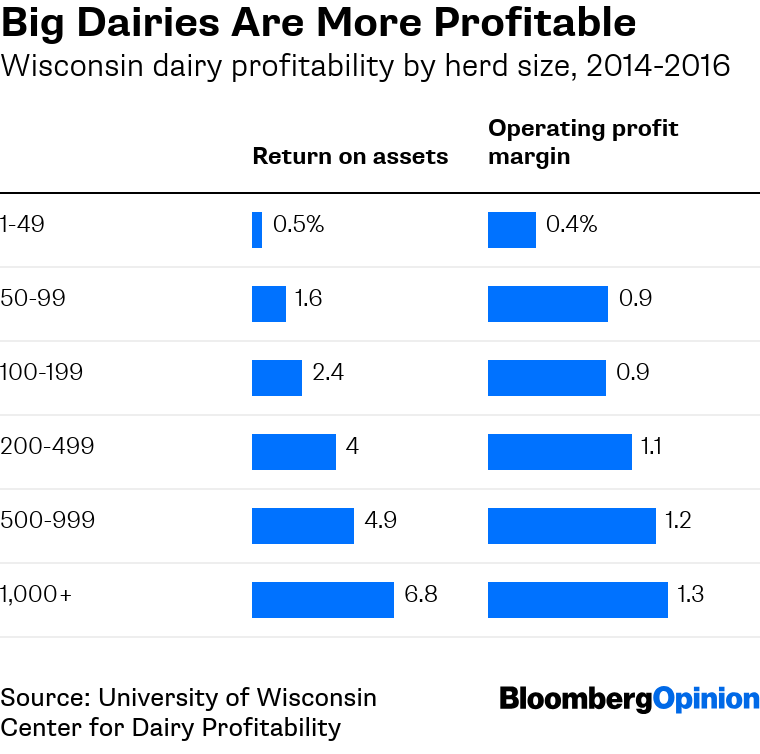
Bigger dairies can spread their overhead costs over more cows, and can thus afford better milking equipment, productivity software and ventilation technology, among other things. The causation also works in the other direction, says Andrew Novakovic, a professor of agricultural economics at Cornell University, as better-run dairies are likelier to invest in expansion, and poorly run big dairies are likelier to be driven out of business because big dairies tend to have much more debt relative to assets than small dairies do. Those high debt ratios help explain why the return on assets is so much higher at the biggest dairies. They are higher-risk, higher-return enterprises.
All this would seem to represent economic progress in action. Environmental progress, too, in the sense that higher production per cow means lower greenhouse-gas emissions per quart of milk. But such change can be wrenching for the dairy farmers being left by the wayside, and for the communities where they live. “I sometimes refer to it as an economic miracle wrapped around a social tragedy,” Novakovic wrote in an email. 4
It’s been especially tragic lately because of a confluence of factors, starting with a 12% decline since 2010 — after decades of little to no change — in U.S. sales of fluid milk. Rising cheese and butter sales have meant that overall U.S. consumption of dairy products has kept rising on a milk-fat equivalent basis, but fluid milk tends to be more profitable than other dairy products, and the shift in the demand mix has left many dairies, and the farmer-owned dairy cooperatives that process and market most milk products in the U.S., scrambling. So have demand shifts within categories. As Bloomberg’s Lydia Mulvany and Leslie Patton reported last October, even amid a general cheese boom, bright-orange American cheese slices have been losing out, which has been tough on the Minnesota and Wisconsin dairies that produce the bulk of the raw material for them.
The result has been a drop in the average milk prices paid to farmers, from $25.46 per hundredweight in 2015 (and $20.45 in the 10 years before that) to $16.20 in 2018. And while such price drops have in the past led to production declines with a lag of three years or so as dairy farmers cut back their herds and brought the market back into balance, that hasn’t really happened yet this time, possibly because of the ongoing shift to bigger dairies. “As we’ve moved to larger-scale operations with different scales of financing, the ability of larger units to produce milk even in low-price periods is basically extended,” says Peter Vitaliano, chief economist at the National Milk Producers Federation. In some cases, he adds, continuing to produce is even an imperative to make debt service payments and otherwise keep the bankers happy.
Finally, there are the trade wars. Exports have accounted for only 4.4% of U.S. dairy production over the past decade, much less than for some other agricultural sectors (with soybeans, it’s been 46.3%). In April, Kevin Drum of Mother Jones put together a bunch of dairy-related charts showing that “neither production, nor price, nor export trends have changed even slightly during Donald Trump’s presidency” — which would seem to indicate that Trump’s tariffs and the reactions of trading partners such as Mexico and China haven’t been a major cause of dairy’s troubles. Also, on the plus side for the dairy industry, the Trump administration recently eased restrictions on the use of milk in school lunches. But the trade tensions may be putting downward pressure on the prices of specific products. And they’re definitely one more thing stressing out dairy farmers who already have a lot to worry about.
As in licensed to sell milk and milk products.
All the pre-1970s dairy statistics in this column are from the U.S. Department of Agriculture Census of Agriculture historical archive maintained by Cornell University’s Albert R. Mann Library.
They can be found in the spreadsheet on “Milk cows and production by State and region” available from the USDA here.
I talked to him on the phone and I emailed with him.
This column does not necessarily reflect the opinion of the editorial board or Bloomberg LP and its owners.
