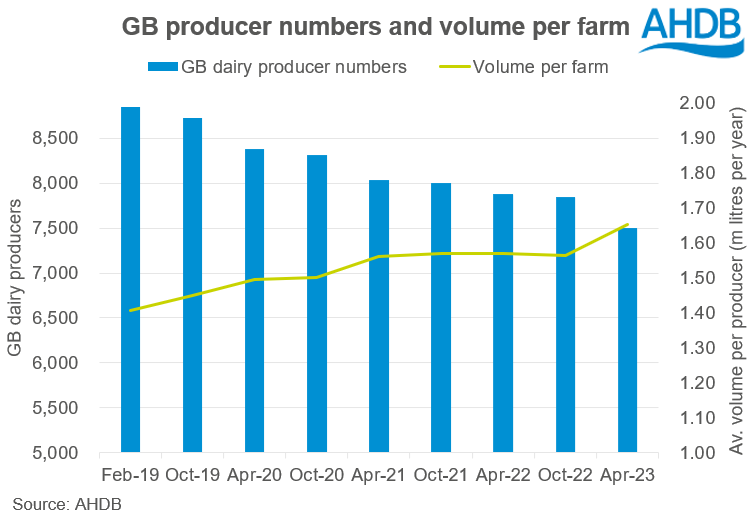
Compared to the April 2022 survey, this represents a reduction of 380 dairy producers (-4.8%), and a fall of 350 (-4.5%) versus our last survey in October 2022.
Compared to previous years, more producers have left the industry. Despite the fact that the latest Agricultural Price Index indicates input cost inflation has eased, input costs remain historically high. In combination with falling milk prices, this has squeezed profit margins for many dairy farmers. The current high level of cull cow prices, as well as ongoing uncertainties about changes to agricultural subsidy schemes has led to some producers changing their future direction.
Despite the number of producers dropping over the last 12 months, good weather conditions last Autumn and the vestiges of higher prices at the end of last year, has meant that average milk production by farm remained high over the autumn and winter months. Milk volumes per farm remain high with the latest figures suggesting that the average GB dairy farm produces 4,500 litres per day, equating to 1.65mn litres per year.
Why do we carry out the survey?
Getting a true picture of the number of dairy producers in the country is often difficult due to the different reporting methods used.
- The Food Standards Agency (FSA) can be used to track producer numbers across England and Wales, based on the number of farmers registered to produce milk. However, deregistering is voluntary, and therefore unlikely to be top of the “to do” list for a farmer leaving the industry. The FSA will often only capture this cessation when a regular check is carried out. These checks occur on a 10-year basis (for those registered with Red Tractor) or a 2-year basis otherwise. This means FSA numbers will often over-state the number of dairy farmers in the country.
- Defra carry out a survey on the number of dairy holdings across the UK, which returns a figure considerably higher than our estimate. This is because it includes all farms with a dairy cow over 2 years old with offspring. Around a third of those holdings had fewer than 10 cows, meaning they are unlikely to be commercial dairy farms, and would be excluded from our estimate.
Notes
AHDB’s estimate represents the number of producers actively contributing to GB milk production. It is based on the number of active producers and temporary inactive producers from the milk buyers that contribute to the Daily Milk Deliveries survey. This covers approximately 83% of volumes in GB, and so the estimate has been adjusted accordingly.

