Data availability
Data will be made available on request.
This study quantifies exposure and impacts to dairy farms from extreme sea level events and relative sea level rise.
Globally, episodic coastal flooding is expected to have increasingly severe impacts on agriculture in low-lying coastal areas, as climate change continues to cause relative sea level rise (RSLR). This study analyses dairy farm exposure and impacts from extreme sea levels (ESL) and RSLR in Aotearoa-New Zealand (A-NZ). Spatio-temporal modelling is undertaken using: 1) a dairy production land layer; 2) a static coastal inundation model from 10, 100, 200 and 500-year annual recurrence interval (ARI) ESL events at 0–2 m RSLR (0.5 m increments); and 3) an Impact State (IS) scheme relating percentage of farmland inundated and depth of flooding at milking shed locations to categorise the severity of damage. Through this analysis we highlight the increasing exposure of the dairy industry to coastal flooding, with 472 farms potentially impacted (at or greater than IS 1) by a 10-year ARI event and 1276 farms exposed to a 500-year ARI event at current sea levels, rising to 1276 (10-year ARI) and 1344 farms (500-year ARI) with 2 m RSLR. RSLR is identified as the factor driving this increase in exposure and severity of impacts to dairying, with the increase in the number of farms impacted in a 500-year compared to 10-year event only 5 % greater when considered with 1 m of RSLR, compared to 37 % greater at 0 m RSLR. This has significant implications for A-NZ where the dairy industry is of high economic and social importance, demonstrating the need for industry targeted climate change adaptation and disaster risk reduction measures.

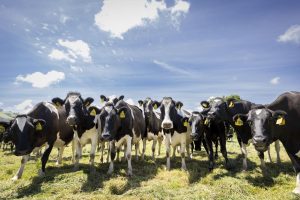
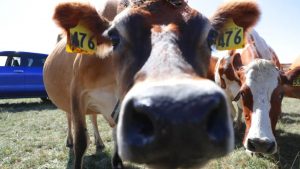
The dairy industry is a vital component of Aotearoa-New Zealand’s (A-NZ) economic and social wellbeing. There are approximately 12,000 dairy farmers across more than 1.7 million hectares, with a further 30,000 people employed in auxiliary services directly supporting the dairy industry[1]. Dairy products are A-NZ’s biggest export earner, accounting for NZ$15 billion in 2020 [2]. Agricultural systems, such as dairy farms, are often located in low-lying areas that could be exposed to coastal flooding, especially with the effects of climate change [[3], [4], [5]].
Globally, the frequency and severity of coastal flooding from extreme sea-levels (ESLs) is increasing due to climate change-driven changes in meteorological systems and relative sea level rise (RSLR) [[6], [7], [8], [9]]. This well-established trend is expected to continue over the coming decades [10]. Small amounts of RSLR (up to 0.2 m) have been shown to double the incidence and magnitude of coastal flooding in low-lying areas [11], with the same effects likely to occur in rural and agrarian settings in A-NZ.
Agricultural systems are particularly sensitive to coastal flooding due to salinity impacts on chemically sensitive components such as soil and vegetation, which have primarily been observed after tsunami events [12,13]. The salinity impacts of seawater incursion depend on: 1) the soil type, where clay soils allow for less penetration of saltwater compared to sandy soils; 2) the amount of rainfall immediately pre- and post-flooding that will help dilute the salinity of the affected soil; and 3) the topography of the affected area that will determine the runoff time [12,[14], [15], [16]]. The Ministry for Primary Industries (MPI) in A-NZ advises farmers that if pasture is inundated with salt water for less than 24–48 h longer-term recovery is likely with some discoloration and reduction in yield, after 48 h most grass species will die with some clover survival, and after 96 h all species will die and require reseeding [17]. However, these impacts and timeframes will vary substantially dependent on the specific pasture species, soil types, soil moisture, seasonality, and pasture quality and condition immediately preceding coastal flooding [18]. The environmental effects of climate change will continue to complicate and alter agricultural vulnerability due to changes in weather patterns, pest species, and livestock disease [19].
Dairy farm flood impacts vary in severity and mechanism, with direct impacts due to flood water contact with the ‘system’, which includes pasture, animals, and fixed assets such as milking sheds, as well as indirect impacts to supporting services such as road access, farm worker availability, and utility supplies. Flooding can impact livestock health directly in both the short- (i.e., drowning) and longer-term (i.e., starvation due to lack of pasture growth) [20]. observed a 50 % increase in mastitis, 30 % increase in lameness, and a 170 % increase in leptospiral infections in cattle herds one year after exposure to fluvial flooding. However, we are not able to make the same quantification of the impacts of coastal flooding due to the focus on fluvial flood events in previous impact assessments. Agricultural flood impact studies have focused primarily on post-event impact surveys [21,22], edaphological impacts [23] or economic effects [24,25] after fluvial flood events.,
The economic reliance and societal importance of dairy farming in A-NZ, coupled with its vulnerability to ESL events (i.e., storm surge) and RSLR, mean that it is vitally importance to protect the dairy sector from the effects of coastal flooding in the future. This necessitates a national-scale assessment of dairy farm exposure and impacts. This study aims to quantify 1) productive land area within each A-NZ dairy farm exposed to ESL driven coastal flooding for different annual recurrence intervals (ARIs) ranging from 10 to 500 years in 0.5 m RSLR increments up to 2 m above present-day MSL; 2) milking shed structure exposure due to ESL events with RSLR; and 3) dairy farm operational impacts using an impact state (IS) schema based on farm-level flood exposure. Additionally, we will also discuss future research directions based on the study findings.
A-NZ is situated in the South Pacific at some distance from other landmasses, therefore it is exposed to ex-tropical cyclones and storms along its nearly 15,000 km of coastline [26]. At current sea levels, these systems commonly cause storm surges, usually causing less than 1 m inundation depths, that are increasingly damaging to coastal infrastructure and amenities [27]. Previous work has estimated that 1457 km2 of agriculture production land could be exposed to coastal flooding from 100-year ARI ESLs at current sea levels [28]. This event exposure increases to 2059 km2 of productive land with 1.2 m of RSLR, estimated to be aligned with 100-year projections using a representative concentration pathway (RCP) of 8.5.
Dairy farming in A-NZ takes place in all regions of the country (Fig. 1), as the increase in irrigation use has meant that even drier regions, such as Canterbury and Otago, have seen a rapid increase in the amount of dairy farming being established [29]. Dairy farms are primarily pasture-based, relying on silage and other crops only as supplementary feed [30]. The usual calendar of activity includes a milking period of approximately 270 days, followed by a drying off period beginning around April/May (when milking is ceased allowing cattle milk secretion to cease and a rest period before calving to begin), with calving usually taking place in August and September [21]. Milking sheds in A-NZ are either rotary (circular platform that rotates allowing cows to walk on and be milked in one rotation) or herringbone types (cows are in angled pens to allow for more cows to be milked simultaneously) [31].

Fig. 1. Dairy farms in A-NZ regions from the AgriBase dataset for the A) North and B) South Island [32].
Rural land-use planning in A-NZ is primarily guided by legislation developed and enacted at a regional level (the reporting level used in this study) through Regional Plans and Regional Policy Statements, informed by national level documents such as National Policy Statements, National Environmental Statements, and the Resource Management Act [33]. These statutory documents are required to consider the impacts of natural hazards, including those caused by climate change and RSLR. However, these are currently primarily focused on actions after an adverse event rather than pre-event mitigative actions [34].
ESL frequencies and magnitudes are quantified for the A-NZ coastline to determine present and future coastal flooding. ESL elevations were estimated for four ARI scenarios ranging from 10 to 500 years. ESL event coastal flooding was mapped using a ‘bathtub’ methodology. Here, a composite national digital elevation model (DEM) comprised of LiDAR and a bias corrected Shuttle Radar Topography Mission (SRTM) satellite derived topographic data was used to identify at-risk land below ESL elevations. Storm-tide and tide data was compiled from tide gauges nationally. RSLR is considered by applying 0.5 m increments up to 2 m for each ESL elevation [35]). This covers a range of climate change scenarios, with 1 m RSLR corresponding to SSP5-8.5 projections for A-NZ [36]. This approach produced a national-scale map suite representing coastal flooding from ESL events under present-day and future RSLR for use in exposure and impact assessments. This study will apply the 10, 100, 200 and 500-year ARI layers at 0, 0.5, 1, 1.5 and 2 m RSLR increments, making a 500-year ARI ESL event with 2 m RSLR the worst-case scenario presented.
The AgriBase database was used to identify A-NZ dairy farm spatial extents and associated livestock numbers [32]. This dataset is a national resource where farmers self-report farm typologies and characteristics and was used under a research license from AssureQuality Kaitiaki Kai, a government agency tasked with ensuring food produced by A-NZ farmers is of a high standard [37]. There are currently 12,646 farms categorized as dairy farms in the database, spread across all regions of A-NZ (Fig. 1). In addition to the spatial identification of dairy farms, livestock count data from the AgriBase dataset was also used to calculate the number of animals living on exposed farms and the stocking rate (in number of animals per hectare).
To understand the types of land within dairy farms that are exposed to coastal flooding, the NZLRI (New Zealand Land Resource Inventory) Land Use Capability (LUC) map was used [38]. This mapping locates areas based on factors that would indicate high levels of productivity (e.g., soil type, soil erosion potential, etc.). In this study we used the categories that are most likely to be intensively used by dairy farmers: LUC1, LUC2, and LUC3 (Table 1).
Table 1. LUC classes and definitions used in this study to represent the most productive land within a dairy farm.
| LUC class | Description [39] |
|---|---|
| 1 | Land with virtually no limitations for arable use and suitable for cultivated crops, pasture or forestry |
| 2 | Land with slight limitations for arable use and suitable for cultivated crops, pasture or forestry |
| 3 | Land with moderate limitations for arable use, but suitable for cultivated crops, pasture or forestry |
Much of the LUC1, 2 and 3 land in A-NZ is situated on loamy soils that have roughly equal amounts of sand, silt and clay [40], meaning that they will allow an average amount of saltwater infiltration [13]. The majority of LUC1, 2, and 3 dairy farming occurs in the Waikato, Taranaki, Manawatū-Whanganui, and Southland regions. Interventions such as extensive irrigation and fertilization are needed outside of these areas [29], leaving them less resilient to changes in fertility induced by the physical and chemical effects of saltwater inundation.
Milking sheds were located using a two-step method. Firstly, building outlines publicly available from the Toitū Te Whenua Land Information New Zealand (LINZ) were identified for dairy farms [41]. The national dataset represents building objects as polygons that allowed for the identification of large complex buildings (i.e., those with a high number of vertices such as rotary milking sheds; Fig. 2 A) on dairy farms indicating milking sheds. However, we noted many cases that building objects on dairy farms were missing with no identifiable milking shed structure (i.e., herringbone type milking sheds; Fig. 2 B). In these cases, milking sheds were manually identified within coastal flooding extents using satellite imagery and the drawn and merged with building outlines.

Fig. 2. Example imagery and assigned footprint for the two main types of milking sheds used on A-NZ dairy farms: A) rotary type; and B) herringbone type.
To attribute an economic value to exposed dairy sheds, the building replacement cost was estimated using 2021 construction costs compiled by Quotable Value. These values differ by region and give a replacement cost per metre squared which is then multiplied by the building area to give a total replacement cost per dairy shed feature [42].
The analysis conducted in this study is completed using the RiskScape® modelling framework software [43]. This involved collating land cover, built asset, and coastal flood hazard spatial information from a range of sources (summarized in Sections 2.2 to 2.4) to build the exposure assessment pipeline illustrated in Fig. 3. The framework is configurable to rapidly estimate coastal flood exposure and impacts to dairy farms and milking sheds over a range of ESL and RSLR scenarios.

Fig. 3. Diagram of the RiskScape pipeline used, showing the datasets utilised and the outputs generated in the exposure assessment.
The ESL and RSLR scenarios and dairy production layers are geospatially processed to identify all spatial intersections. Milking sheds are centroid sampled, and a maximum inundation depth identified (Fig. 3).
We then configure RiskScape® to undertake a consequence analysis to calculate dairy farm exposure and impact using the following conceptual framework:(1)�=��(�,�)∈��Where the predicted impacts (I) are function (fc) of the ESL flooding and RSLR hazard (H) and the exposed dairy farms (E), and then correlated with an impact state (IS); based on the ratio of exposed area within a dairy farm and the depth of inundation at milking shed centroids.
Results were aggregated at a farm and regional level based on both the exposure in terms of land area and flood depth at the milking shed location (Fig. 3). Exposure area was also enumerated in terms of the LUC classification, to demonstrate the impact to the most productive areas of land within a farm.
To assess the impacts to dairy farms due to ESL events with RSLR, an IS scheme is proposed (Table 2) and enacted as the final step in the exposure assessment modelling pipeline (Fig. 3). This approach has been successfully applied across many hazards and industries and allows comparison of the results at different spatial scales [[44], [45], [46]]. This scheme uses an exposed ratio (i.e., the percentage of pasture covered), then assigns an IS based on pasture damage. This approach is applied rather than using an inundation depth due to the binary nature of damage caused to pasture species common to A-NZ dairy farms (e.g., ryegrasses and clover [23,47]) by saltwater incursion where pasture can be injured regardless of the depth of the flooding [[48], [49], [50]].
Table 2. Proposed IS scheme for dairy farms exposed to coastal flooding.
| Impact State | Description | Pasture covered (%) | OR Milking shed inundation (m) |
|---|---|---|---|
| 0 | No impact | <10 | <0.8 |
| 1 | Temporary decrease in milk yield | 10–25 | 0.8–1.5 |
| 2 | Partial destocking or drying-off | 25–75 | 1.5–2 |
| 3 | Total loss of production through destocking and/or pasture/asset damage | >75 | >2 |
This trend does not apply when considering milking shed damage and recovery, where shallower flood depths can be remediated against rapidly enough to get the system functional within a minimal amount of milking cycles. Depth thresholds were selected based on damage observed after the 2017 Bay of Plenty floods [21], floor heights, componentry heights (e.g., electrical systems for pumping and refrigeration) and life safety hazards for both humans and animals [20].
The maximum IS calculated based on the pasture covered and milking shed inundation depth is assigned to the farm as the overall IS for that property (Fig. 3).
Using a compilation of current construction costs [42], the average replacement value of dairy sheds exposed to ESL events was calculated.
The likely farmer interventions, external assistance and medium to long-term management strategies associated with each IS are presented in Table 3 [3,15,17,21,22,50].
Table 3. Recovery actions associated with dairy farm IS after ESL flooding.
| Impact State | Farmer intervention | External assistance | Medium to long-term management |
|---|---|---|---|
| IS0 |
|
None | None |
| IS1 |
|
|
None |
| IS2 |
|
|
|
| IS3 |
|
|
|
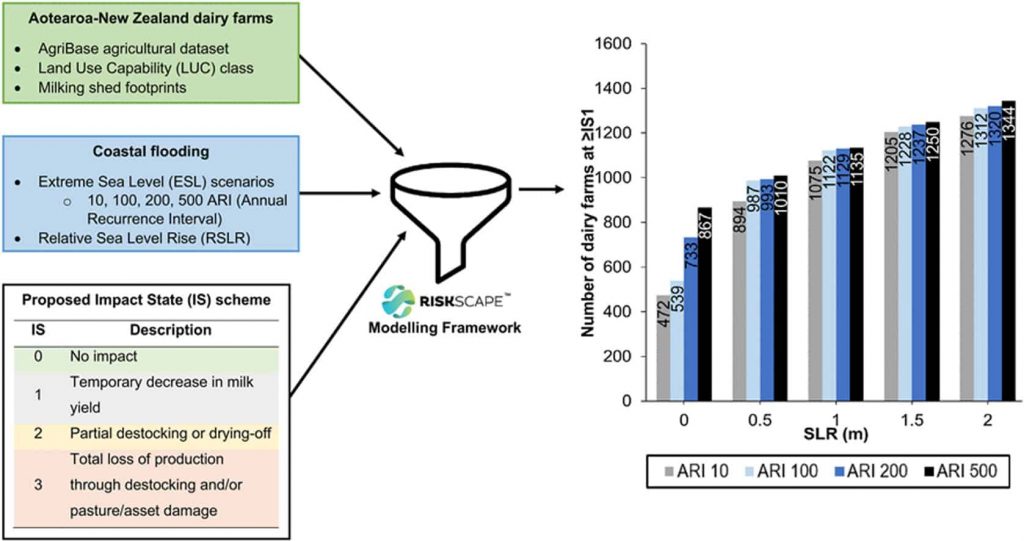
The number of dairy farms that have more than 10 % of their land area exposed (i.e., at or above IS1) to coastal inundation from ESL events at current sea levels rises from 472 farms with a 10-year ARI event to 539 farms at 100-years ARI, 733 farms at 200-years ARI and 867 farms at 500 -year ARI (Fig. 4). However, the rise in the number of farms exposed with increasing event ARIs becomes less pronounced when RSLR is also factored into hazard models. For example, even with a conservative RSLR of 0.5 m, the number of dairy farms with at or above IS1 is 894 for a 10-year ARI event, 987 farms for 100-year ARI, 993 for a 200-year ARI, and 1010 for a 500-year ARI (Fig. 4). Similarly, the number of farms suffering from impacts requiring destocking and/or ceasing production temporarily (IS3) is 527 farms for 100-year ARI flooding, and only 530 with a 200-year ARI (Table A1). This demonstrates that the driving force behind increasing dairy farm exposure to coastal flooding is RSLR rather than the event intensity or frequency. The same trend can be observed when assessing exposed farm numbers on a regional basis, where the higher ARI ESL events do not substantially increase the numbers of farms exposed from 0.5 m RSLR onwards (Fig. 5B–E). This RSLR value also represents the sea level where many stopbanks and floodgates would begin to be ineffective at protecting agricultural land. This has implications that require consideration when investing in future hazard modelling and risk assessments. In identifying RSLR as the primary driver for increasing dairy farm exposure, this signals that we can expect severe impacts to large numbers of farms that were previously only experienced during very large and infrequent events (i.e., 200 and 500-year ARIs), to now occur much more frequently even with relatively small ESL events. This is important information for emergency managers, rural communities and farmers who will be managing this increase in impacts at a farm level; and for insurers, rural support agencies and businesses, and the wider A-NZ economy who will experience these impacts at a larger scale.

Fig. 4. Number of dairy farms reaching or exceeding IS1 when exposed to ESL flooding.

Fig. 5. Proportion of dairy farms with predicted impacts of ≥IS1 at A) 0 m RSLR; B) 0.5 m RSLR; C) 1 m RSLR; D) 1.5 m RSLR; and E) 2 m RSLR and ESL events with 10, 100, 200, and 500-year ARIs.
Regions with the highest proportion of affected dairy farms are Otago, Northland, and Bay of Plenty. Approximately 15–20 % of farms in these regions are predicted to have impacts of ≥IS1 with 2 m RSLR at 10-years ARI, or 1 m RSLR with a 100-year ARI event (Fig. 5). In terms of overall farm numbers that will likely require external assistance in reestablishing normal production levels, the Waikato region is most impacted in all scenarios (Table 4), with over 250 farms at IS3 at all recurrence intervals with only 0.5 m RSLR (Table A1).
Table 4. Regional number of farms with modelled impacts of ≥IS1 at a given extreme event frequency (ARI) and RSLR (≤10 farms are white, then bands of grey to black to represent 11–100, 101–150, 151–200, 200–300, and >300 farms).

For regions such as the Waikato, Otago, Northland, and Bay of Plenty, there will be a considerable cost to recovery with large numbers of farms requiring supplementary feed to be brought in and extensive milking shed repairs and pasture rehabilitation (Table 3). This would likely be funded through private insurers. There is the potential for government relief funds, however these are unlikely to cover the full cost of recovery, particularly for farms with higher IS values.
Individual farm recovery after an ESL event will be more challenging if the most productive land cover areas of a farm are inundated. Applying the exposure assessment to the LUC layer allows for a greater understanding of the likely influence that land-cover productivity differences will have on affected areas. LUC 1, 2 and 3 areas within a dairy farm are areas where the least number of interventions are needed to maintain productivity [38]; however, these areas are disproportionately affected by ESL events due to their tendency to occur in low-lying loamy soils, with over 80 % of LUC 1–3 land in dairy farms is at less than 100 m above sea level.
To assess regions where individual farms will likely have further significant impacts due to the loss of the most productive land, the number of farms where over half of the total amount of LUC 1–3 land cover within an individual farm is exposed to inundation were identified for each region. The Waikato region has the highest number of these farms at all ESL event ARIs and RSLR values, with 90–332 farms meeting this criterion at 0 m RSLR and 436 to 446 farms at 1 m RSLR, for ARI 10 and 500-year ESL events respectively (Fig. 6A–D). As with when considering all dairy farmland types, the minimal increase in the number of impacted farms between ARI 10 and 500-years at 2 m RSLR demonstrates the importance of relative RSLR as the driving factor for increasing exposure. Bay of Plenty and Northland have the next highest number of exposed farms (Fig. 6A–D). A feature of note is the lower number of farms with greater than 50 % LUC 1–3 exposed in the Wellington region than when compared to whole-farm exposure (Fig. 5, Fig. 6). This is likely due to the location of much of the most productive land in the inland reaches of the Ruamahanga River valley, distal from coastal hazard areas.

Fig. 6. Regional number of farms where greater than 50 % of the LUC1-3 land cover on the individual farm is exposed to ESL events (A) 10-year ARI; B) 100-year ARI; C) 200-year ARI; and D) 500-year ARI) with 0 m, 1 m, and 2 m RSLR.
Nationally at least NZD $224 million of dairy sheds are exposed to 10-year ARI ESL events at 2 m RSLR (up to NZ $233 million with a 500-year ARI event) (Fig. 7). This value is relatively modest at a national scale as most dairy sheds are constructed central to the farm and away from coastal margins. Most of this exposure occurs in the North Island. These values only consider the direct replacement value of the physical assets that comprise the dairy shed system (buildings, yard space, milking machines, electrical, railings, gates, etc.) and do not include the significant production losses that would occur during the time it takes to repair or replace the milking shed infrastructure.

Fig. 7. National replacement costs for exposed dairy sheds for 10, 100, 200 and 500-year ARI ESL events in 1 m RSLR increments (North Island no pattern, South Island spotted pattern, assuming an average of 50 bails per shed) [42].
As with the overall exposure levels (Section 3.1.), the Waikato region had the highest value of milking sheds exposed with over NZ $107 million in replacement costs with 2 m RSLR regardless of the ARI of the ESL event (Table A2). The trend in these costs appears independent from the magnitude of the ESL event and almost completely reliant on RSLR for many of the most exposed regions (i.e., Waikato, Northland, Southland, Taranaki, and Wellington with a less than 2 % increase in costs between 10 and 500-year ARI events at 2 m RSLR; Table A2). The influence of ESL event size on dairy shed costs is more pronounced in the South Island where at the same RSLR increments there is an increase of over 8 % in replacement costs between 10 and 500-year ARI events.
Livestock numbers living on dairy farms that are exposed to ESL events and RSLR, range from 175,000 for a 10-year ARI event at current sea levels to over 510,000 cattle for a 500-year ARI event at 2 m RSLR. This indicates the potential for significant animal welfare issues to arise after an event, especially as RSLR continues to occur. As with the other exposure measures, the Waikato region has the highest livestock numbers likely to be impacted, with over 160,000 at all magnitude events with 2 m RSLR (Table A3). However, as these events are likely to be regional in nature and response, where animals can be transported to neighbouring farms where possible, it is useful to look at the proportion of animals within a region exposed to give an indication of how practical intra-regional livestock transfers would be. In the Bay of Plenty region, movements may be challenging with between 28 and 32 % of dairy cattle in the region being located on exposed farm in a 500-year ARI scenario with 2 m RSLR. Similar barriers to movement may also occur in the Auckland, Gisborne, Northland, Otago, and Wellington regions as greater than 15 % of regional dairy cattle are on exposed farms (Table A3). This could potentially create animal welfare issues if an area is inundated rapidly before livestock can be safely moved, if the impacted area is large enough that livestock numbers are prohibitive, or if supporting infrastructure such as roads and bridges are damaged.
A major limitation of this exposure and impact assessment, is the inability to accurately quantify the likely residence time of any inundation. This has a significant impact on the medium-to long-term (weeks to months) recovery of pasture. Ryegrasses have been observed to completely die out if inundated with salt water for 36 h or longer [23], requiring soil rehabilitation and replanting. Currently, the coastal hazard models available for A-NZ at a regional and national scale are not able to accurately predict the residence time of salt-water inundation. Further hazard modelling at a local, sub-regional scale would be required to incorporate this into any future impact predictions.
An additional temporal issue to consider is the time of year that the flooding occurs. Farm activities at the time will dictate impacts, with the number of calves and pregnant cattle increasing vulnerability and the number of dried off stock potentially decreasing vulnerability and reliance on milking infrastructure, storage, and transportation. This seasonality component should be incorporated and considered in future studies as the effects of farm activities on impacts are better quantified.
Whilst the IS scheme provides a framework for comparison of the severity of impacts at various scales, they also seek to simplify and standardize a complex system of vulnerabilities and interdependencies that comprise a dairy farm. This introduces inaccuracies, particularly at a farm-scale where specific characteristics may make a farm more resilient or vulnerable. An example of this is that if only a small number of farms in an area are impacted by a particular ESL event, then it is possible that arrangements may be rapidly made for livestock to be moved elsewhere or milking facilities to be shared. However, the likelihood of these arrangements being available is decreased as relative RSLR continues globally, and it becomes more likely that a wider area will be impacted by ESL events.
Ideally, fully quantitative impact assessment models will be developed for specific agricultural sectors, environments, and operating systems, that consider and enumerate specific vulnerability characteristics. This would allow for improvement in forecasting ability that cannot be achieved using the IS schema proposed here; however, it will also require detailed farm-scale assessments pre- and post-ESL event that are yet to be undertaken.
Further work is required at a farm-level to better delineate productive and unproductive land that will be affected by ESL events in the future. It is likely that more marginal land will become uneconomic more quickly and differing land-uses need to be considered. The LUC scheme applied in this study begins this work, with the Waikato, Bay of Plenty, and Northland regions having their most productive land parcels most effected, driving the likely need for timelier agricultural diversification.
This study shows regional and national scale exposure to the dairy farming industry from the combined threat of ESL events with ongoing climate change driven RSLR. The economic and social reliance on the dairy industry in A-NZ means that understanding the likely impacts associated with this exposure are vital for ongoing mitigation and disaster risk reduction efforts. The number of farms affected by greater than 10 % inundation (≥IS1) during a 10-year ARI event doubles to over 800 farms with only 0.5 m RSLR. Furthermore, there is a difference of less than 6 % in the number of farms at greater than or equal to IS1 with 2 m RSLR between a 10-year and a 500-year ARI ESL event. These findings demonstrate that relative RSLR is the primary driving force for increasing dairy farm exposure in A-NZ, rather than the magnitude of the ESL event. This means that ESL events with severe impacts will occur much more frequently in the future as a 10-year ARI event begins to have the same effects as a 500-year event previously. These findings are significant as climate change continues to both accelerate RSLR and place pressure on the agricultural system as a whole furthering the exposure and vulnerability of the dairy industry both in A-NZ and globally. These types of exposure assessments will allow for consideration of the distribution of farm-scale vulnerabilities across A-NZ, facilitating further work on increasing dairy farm resilience, improving response and recovery plans, and providing support targeted to areas most likely to experience frequent negative consequences as RSLR continues.
Funding was provided through the Deep South research program of the National Science Challenges (Project titled: ‘Primary sector preparedness for climate change’). Additional support was provided by NIWA Taihoro Nukurangi through the New Zealand Government’s Science Strategic Investment Fund (SSIF), grant number CARH2206.
The authors declare the following financial interests/personal relationships which may be considered as potential competing interests:Alec Wild reports a relationship with Aon Ltd that includes: employment.
The following is the Supplementary data to this article.
Multimedia component 1.
Data will be made available on request.