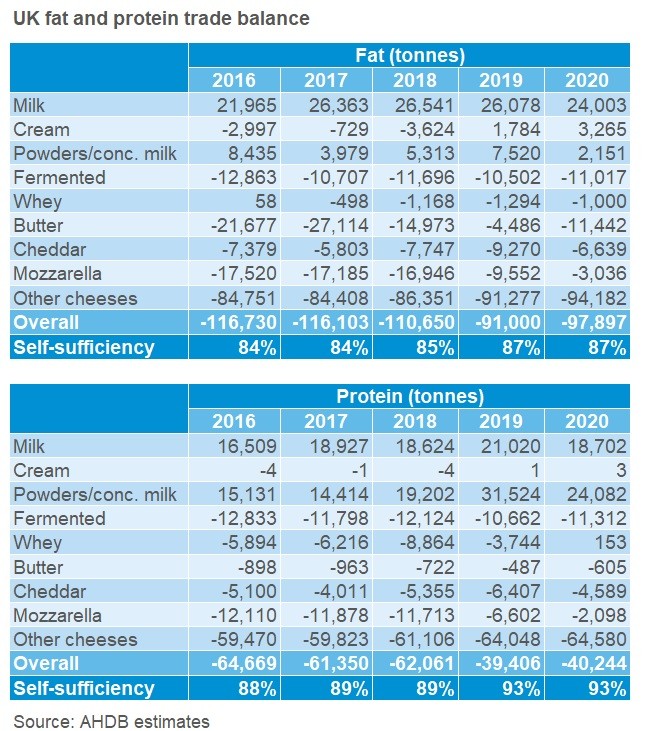
This switched to a trade surplus in volume terms in 2019 and 2020, though we continue to trade at a deficit in value terms. Much of the value in a dairy product comes from its constituents, and so looking at our trade balance in terms of fat and protein can provide valuable insight on demand for milk solids.
In 2020, both the fat and protein trade deficits grew, with the fat deficit up 8% on 2019 and the protein deficit up 2%. However, both these deficits are still considerably smaller than those seen in 2016-2018.
1
The increased fat trade deficit was partly driven by butter, where the trade deficit increased. High retail demand in the UK kept imports at a similar level to the previous year, and may have kept more domestic product in the country, as we saw reduced exports – though reduced demand from the continent may also have contributed. A reduction in our powder export surplus, particularly for WMP, also contributed to the increased fat deficit.
However, this was counterbalanced by some categories improving, for example Cheddar and Mozzarella had lower fat trade deficits year on year. Mozzarella exports continued to improve on the back of increased production capacity. For Cheddar, both imports and exports were down, but imports more so. For imports this is likely due to reduced foodservice demand in the UK, as the sector usually uses a lot of commodity Irish cheddar. Meanwhile, exports were lower due to reduced demand abroad, but potentially also due to increased domestic demand in the retail sector.
For protein, a substantial drop in the surplus from powders helped drive the growth in the overall deficit. This was down to lower exports of SMP and WMP compared to 2019. On the other hand, Cheddar and Mozzarella had reduced protein deficits in 2020, correlating with their reduced fat deficits. Additionally, whey products went from a protein deficit of 3,740 tonnes in 2019 to a small 150 tonne surplus in 2020, mainly due to lower imports.
Looking forwards, 2021 will bring an interesting year for our trade balance. With increased trade friction putting a damper on exports since January, but the same regulations not set to hit imports until October, this could sway things in favour of an increased deficit. However, this is not yet guaranteed.


