Monthly price swings in grocery stores for individual food categories, as measured by the Consumer Price Index (CPI), tend to smooth out into modest yearly increases for food in general. In 2019, U.S. consumers, businesses, and government entities spent $1.77 trillion on food and beverages in grocery stores and other retailers and on away-from-home meals and snacks.
 Average annual food-at-home prices were 3.5 percent higher in 2021 than in 2020. For context, the 20-year historical level of retail food price inflation is 2.0 percent per year—meaning the 2021 increase was 75 percent above average. Meat and fish prices rose most sharply; beef and veal prices increased 9.3 percent, pork prices increased 8.6 percent, fish and seafood prices increased 5.4 percent, and poultry prices increased 5.1 percent in 2021. Fresh fruit prices also increased by 5.5 percent in 2021. Dairy products and fresh vegetables were the only included categories with price increases lower than their historical average.
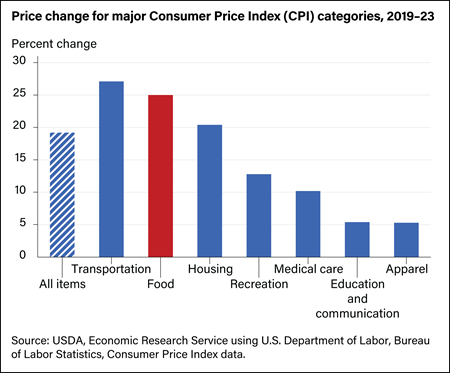 From 2017 to 2021, the all-food CPI rose 11.1 percent, which is higher than the all-items CPI. Food price increases were below the 11.7-percent rise in housing costs and the 14.4-percent increase in transportation costs. Retail pricing strategies, efficient food supply chains, slow wage growth, and relatively low oil prices tempered food price inflation from 2017–2019. However, 2020 and 2021 were years of high food price inflation due to shifts in consumption patterns and supply chain disruptions resulting from the coronavirus pandemic and associated mitigation efforts.
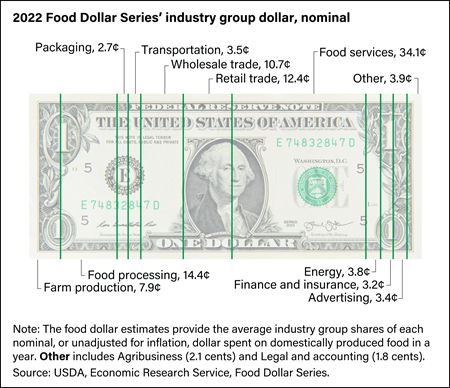 For a typical dollar spent in 2021 by U.S. consumers on domestically produced food, including both grocery store and eating-out purchases, 33.6 cents went to foodservice establishments such as restaurants and other eating-out places. This amount resumes the foodservices share’s upward trend after it declined in 2020, due to changes in food-away-from-home spending early in the Coronavirus (COVID-19) pandemic. For the remainder of the food dollar, retail trade (12.7 cents) decreased to its lowest share since 1995 and wholesale trade (10.7 cents) decreased to its lowest share since 2011.
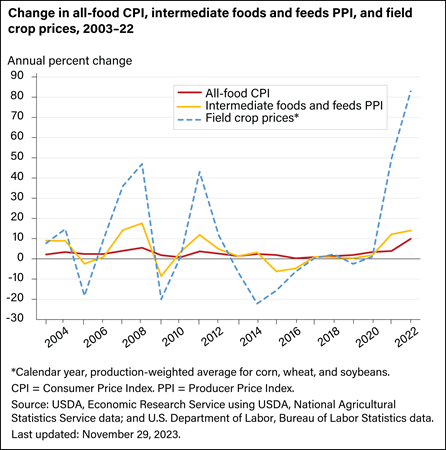 Corn, wheat, and soybeans are the top three U.S. field crops and comprise the majority of field crop inputs to the U.S. food supply. The average farm price of these crops, weighted by total production, regularly rises or falls by more than 10 percent from year-to-year. However, these price swings have relatively small impacts on food prices. In 2021, the production-weighted price of these crops increased by 50 percent while food prices increased by 4 percent. Price fluctuations of intermediate foods and feeds generally fall between swings in field crop and food prices.
 Food prices typically move in the same direction as fuel prices, often with a slight lag, as it takes time before fuel costs are incorporated into food prices. Although the direction is often the same, the sizes of the price swings differ. Over the past 2 decades, motor fuel and household energy prices have experienced double-digit, annual price swings, while food prices have posted annual increases of between 0 and 6 percent, for an average, annual increase of 2.4 percent.
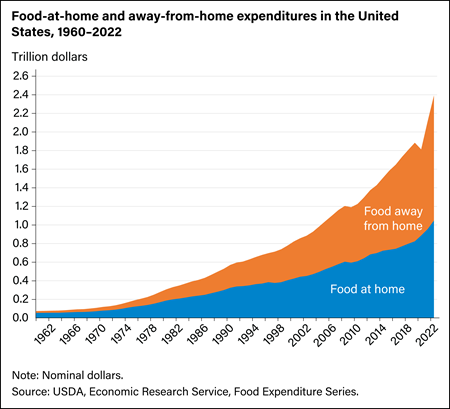 In 2021, food spending by U.S. consumers, businesses, and government entities totaled $2.12 trillion, recovering from a sharp decline in 2020 in which the food market was disrupted by the Coronavirus (COVID-19) pandemic and the recession in which food spending totaled $1.81 trillion. Food-at-home spending increased from $888.2 billion in 2020 to $955.6 billion in 2021 and food-away-from-home spending increased from $922.2 billion in 2020 to $1.17 trillion in 2021. Food-away-from-home spending accounted for 55 percent of total food expenditures in 2021, returning to pre-COVID-19 pandemic share levels.
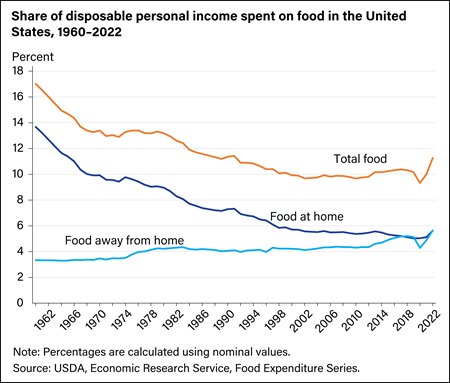 In 2021, U.S. consumers spent an average of 10.3 percent of their disposable personal income on food—divided between food at home (5.2 percent) and food away from home (5.1 percent). The share of disposable personal income spent on total food has trended downward since 1961—driven by a decline in share of income spent on food at home. The Coronavirus (COVID-19) pandemic resulted in the sharpest annual decline in the share of disposable income spent on total food since 1967. In part, this decline was the result of the largest annual increase in disposable personal income since 2000 and the sharpest decrease in food-away-from-home spending. In 2021, the share of disposable personal income spent on total food returned to 2019 levels at 10.3 percent. Note that the shares in this chart do not include spending by businesses and government entities.
 U.S. households with higher incomes spend more money on food, but the amount spent represents a smaller overall portion of their budgets. In 2021, households in the lowest income quintile spent an average of $4,875 on food (representing 30.6 percent of income), while households in the highest income quintile spent an average of $13,973 on food (representing 7.6 percent of income).
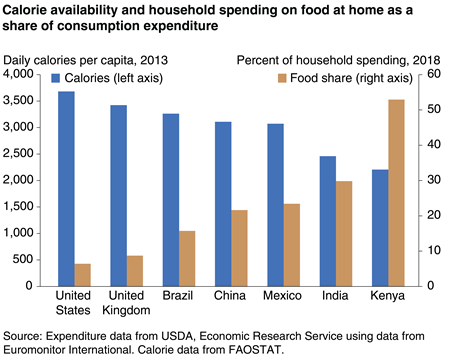 High-income countries such as the United States and the United Kingdom have higher food spending in absolute terms, but the share of household consumption expenditures devoted to at-home food is low—less than 10 percent. In Kenya and other low-income countries, at-home food’s share of consumption expenditures can exceed 50 percent. Per capita calorie availability follows the reverse pattern. According to the most recent available data, U.S. per capita calorie availability was among the highest at 3,682 calories per day, while Kenya’s was estimated at only 2,206 calories.


