Looking at the milk production and product stock situation, in combination with demand expectations, can provide an early view on likely pricing developments through the year.
Milk production
At a global level, forecasts suggest limited growth in milk production across the key surplus regions. In total, supplies are expected to increase by just over 1% in 2021, compared to the 1.4% growth recorded in 2020[1]. The lion’s share of this extra milk is expected to come from the US and the EU[2]. However, rising feed costs in both of these regions could put farmer margins under pressure and restrict supply growth in the second half of the year.
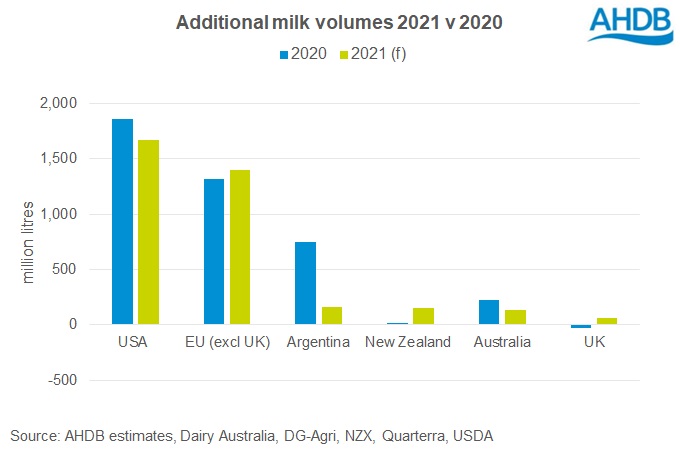
New Zealand (NZ) dairy farmers are reported to be in a good position going into the new season, with a profitable price forecast and strong demand for their product leading to good supply growth. Beyond any adverse weather events, the largest risk to this will be a slowdown in Chinese import demand.
Demand
Demand for dairy has remained strong through 2020 and will continue to be the key driver in dairy markets through 2021. Economic growth around the world is improving, and foodservice demand returning.
Recent projections from the World Bank suggests global growth of 4% in 2021, following a contraction of 4.3% in 2020.
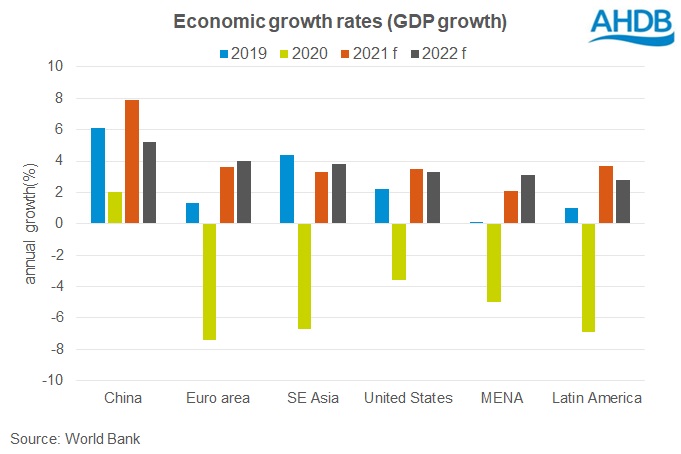
Economic recovery will vary by country, although forecasted income growth looks set to remain strong in China, maintaining robust import demand. In addition, rising foodservice sales, high domestic milk prices and government messaging around the health benefits of milk are expected to keep China’s import demand strong through 2021. There is some risk that import demand could weaken in the latter part of the year, particularly if prices continue to increase or stocks build too high.
In both US and EU markets, the return of domestic foodservice demand will be important in maintaining profitable price levels. In these markets, the expectation is that sales will begin to recover through 2021 as vaccination programmes roll out. However, sales are not expected to reach pre-Covid levels by the end of the year. Industry estimates[3] suggest that sales will still be 22% and 27% lower than 2019 levels by Q4 2021 in the US and EU respectively.
Product availability
Recent price trends on global markets are positive across all dairy products. In most cases, current pricing is at or above the 5-year average, with the exception of butter in the US. This is a positive in terms of supporting farmgate pricing, although the level of support will be subject to how product availability develops relative to demand.
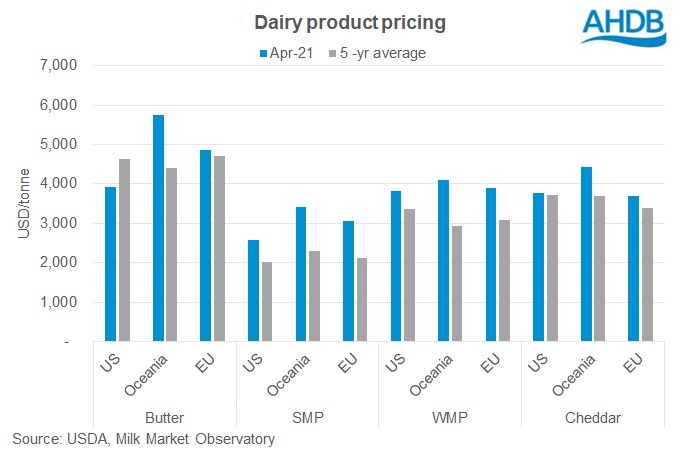
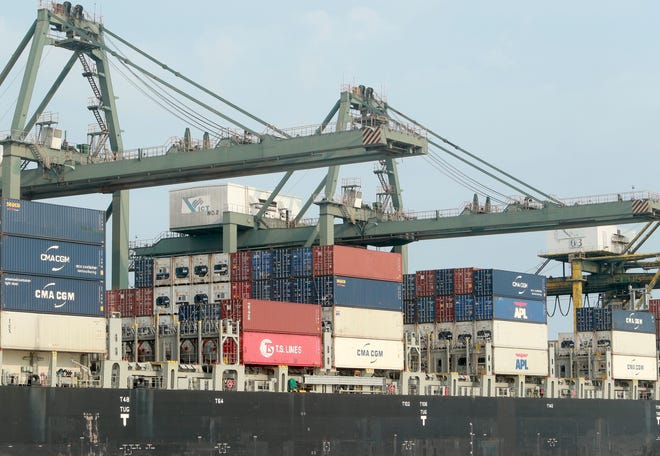
The US has relatively high stocks for both butter and cheese, while SMP stocks are only slightly higher year on year. However, this is not expected to put undue pressure on global pricing while shipping costs remain high, and availability of containers is limited. Strong domestic demand for butter and cheese, resulting from government buying and restocking in the foodservice sector, is helping to keep US prices from falling.
Meanwhile, EU stocks are reported to be well balanced for cheese and butter, but low for SMP. A year of strong exports and lower product production has kept stocks from building up. Higher domestic demand, and limited milk supply growth, is expected to constrain the EU’s exportable supplies in 2021, which should support prices on global markets.
Although there is no data on stocks for NZ, strong exports to China in recent months suggest tight supplies. With limited growth in milk supplies expected in the 2021/22 season, the risk of excessive stock build up is low.
Farmgate prices
Overall, indications are positive for market returns in the short term, which should support farmgate prices. There are some risks to markets later in the year which could put some downward pressure on prices. Lower Chinese import demand, increased availability of US products on global markets, or a delay in the return of foodservice demand, could all limit further positive price movements.
The question that remains is whether farmgate prices can achieve sufficient increases to compensate for rising operating costs.
[1] Adjusted for the leap year in 2020.
[2] The EU includes the 27 member states, excluding the UK.
[3] Gira estimates
