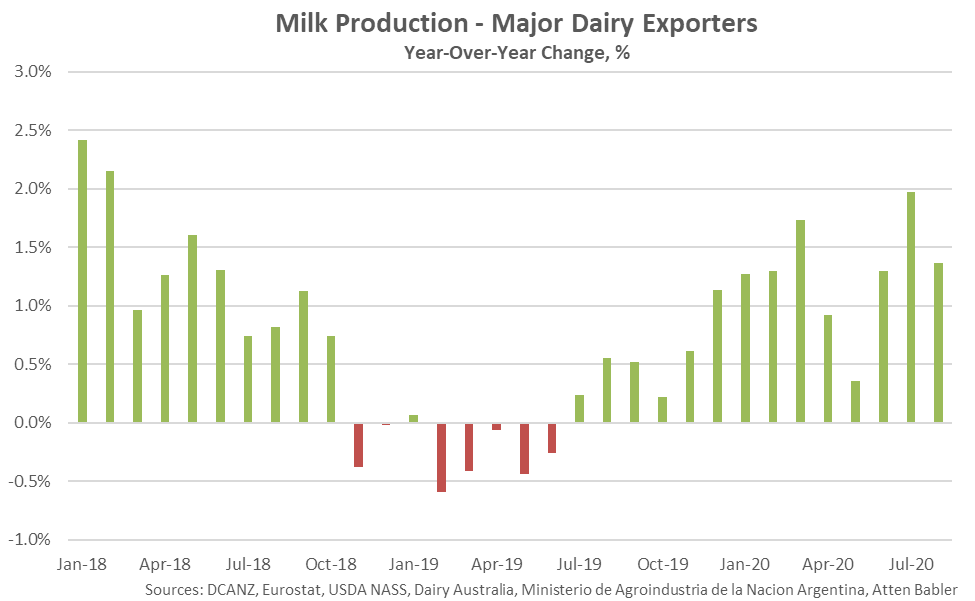
The aforementioned regions combined to account for over 90% of global butter, cheese, whole milk powder and nonfat dry milk export volumes throughout 2019. 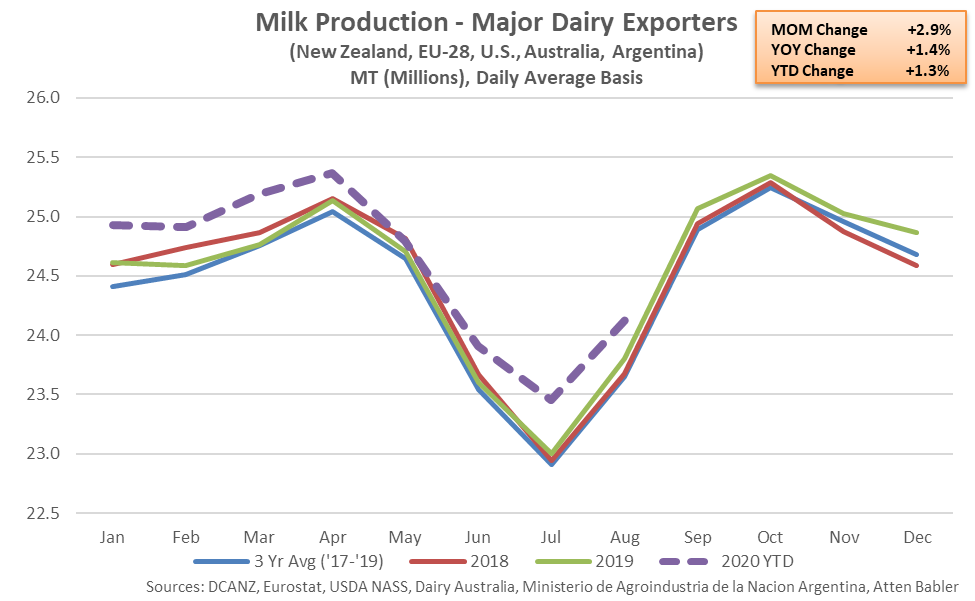 Combined milk production growth rates experienced throughout the major dairy exporting regions decelerated over much of 2018 but remained positive until Nov ’18, when production volumes declined on a YOY basis for the first time in the past 22 months. Combined milk production volumes finished largely flat or lower on a YOY basis over eight consecutive months through Jul ’19, prior to finishing higher throughout each of the past 14 months through Aug ’20.
  Aug ’20 YOY increases in milk production were widespread across the major dairy exporting regions and led on a percentage basis by New Zealand (+5.3%), followed by Argentina (+5.0%), Australia (+3.5%), the U.S. (+1.8%) and the EU-28 (+0.3%). The EU-28 produces significantly more milk than the other dairy exporting regions, accounting for over half of the combined production within the five exporting regions during Aug ’20. Production gains have been widespread across the major dairy exporting regions for three consecutive months through Aug ’20, the longest consecutive streak experienced throughout the past five years.
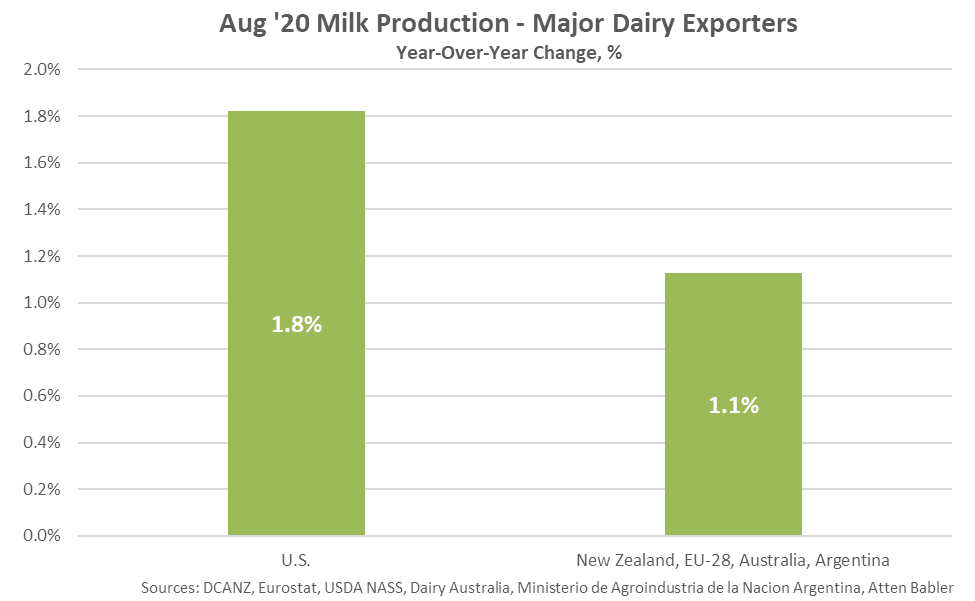
 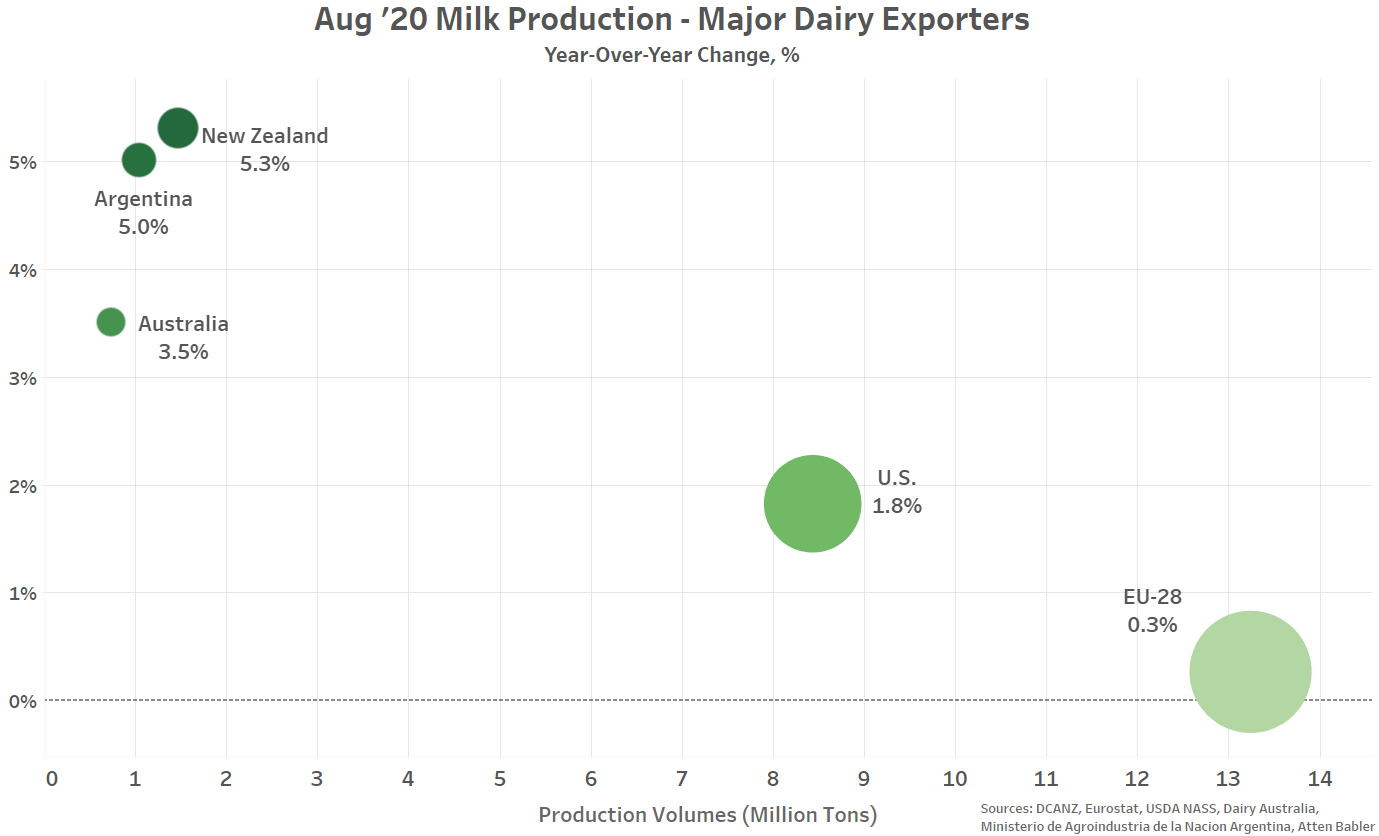 Excluding the U.S., milk production within the major dairy exporting regions increased by 1.1% on a YOY basis throughout the month of August, finishing below the growth rate exhibited within the U.S. for the first time in the past four months.