These articles remain among the most read Ag Data News articles behind Russia-Ukraine, fertilizer, pineapples, and (of course) chicken sandwiches.
This week, I address the number one question raised by the prior articles: have these subsidies caused the number of dairy cows to increase?
Next week, I’ll write an update on the economics of anaerobic digesters and the role of subsidies from federal and state programs.
Background
The number of dairy cows in the US declined from 17.5 million in 1960 to a minimum of 9 million in 2004, before rebounding slightly in the ensuing 20 years. Milk production increased throughout this period as farmers increased the amount of milk obtained from each cow.
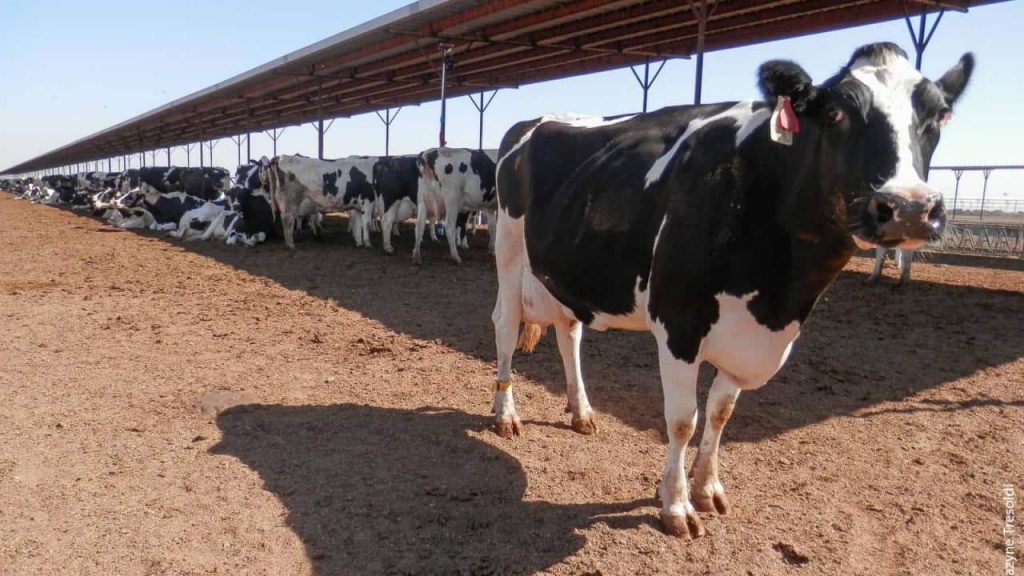
Dairy production has become concentrated in fewer states as consumers have shifted from drinking fluid milk, which is expensive to transport, to more easily transported products such as butter and cheese. Wisconsin was the biggest dairy producing state in 1960, followed by New York and California. California production more than tripled in the 30 years from 1977 to 2007. It overtook Wisconsin in production in 1993 and in number of cows in 1998.
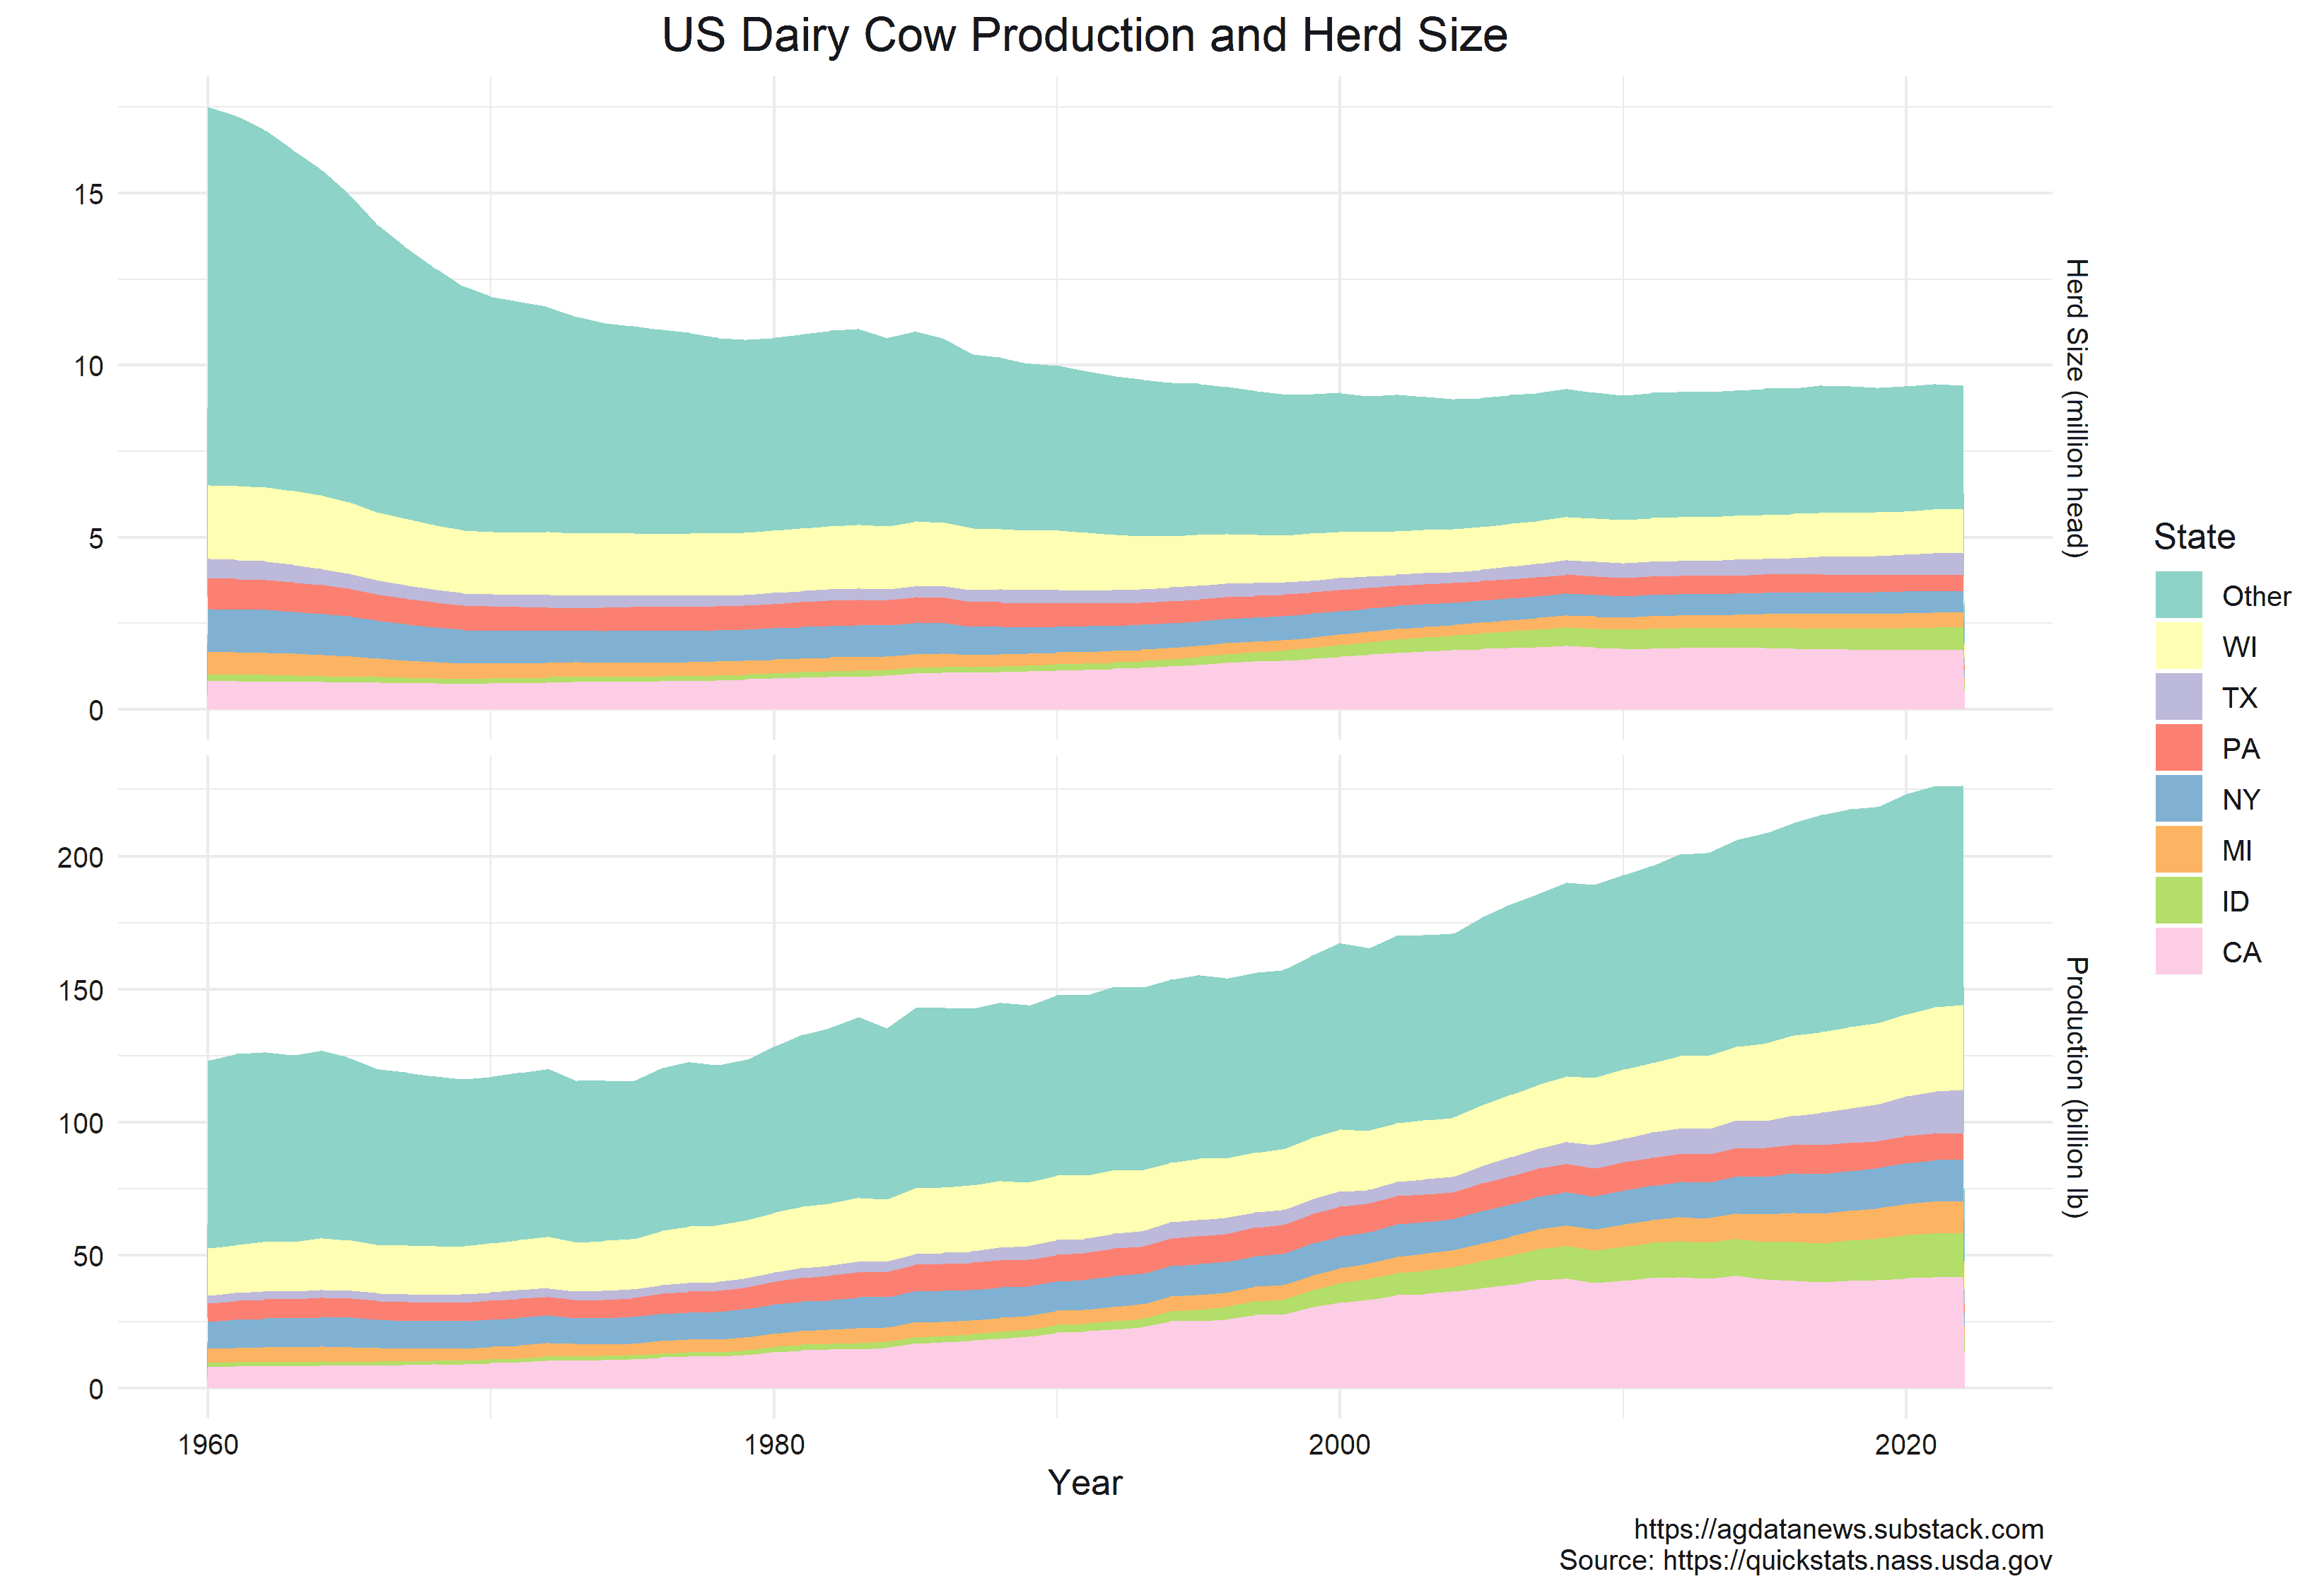
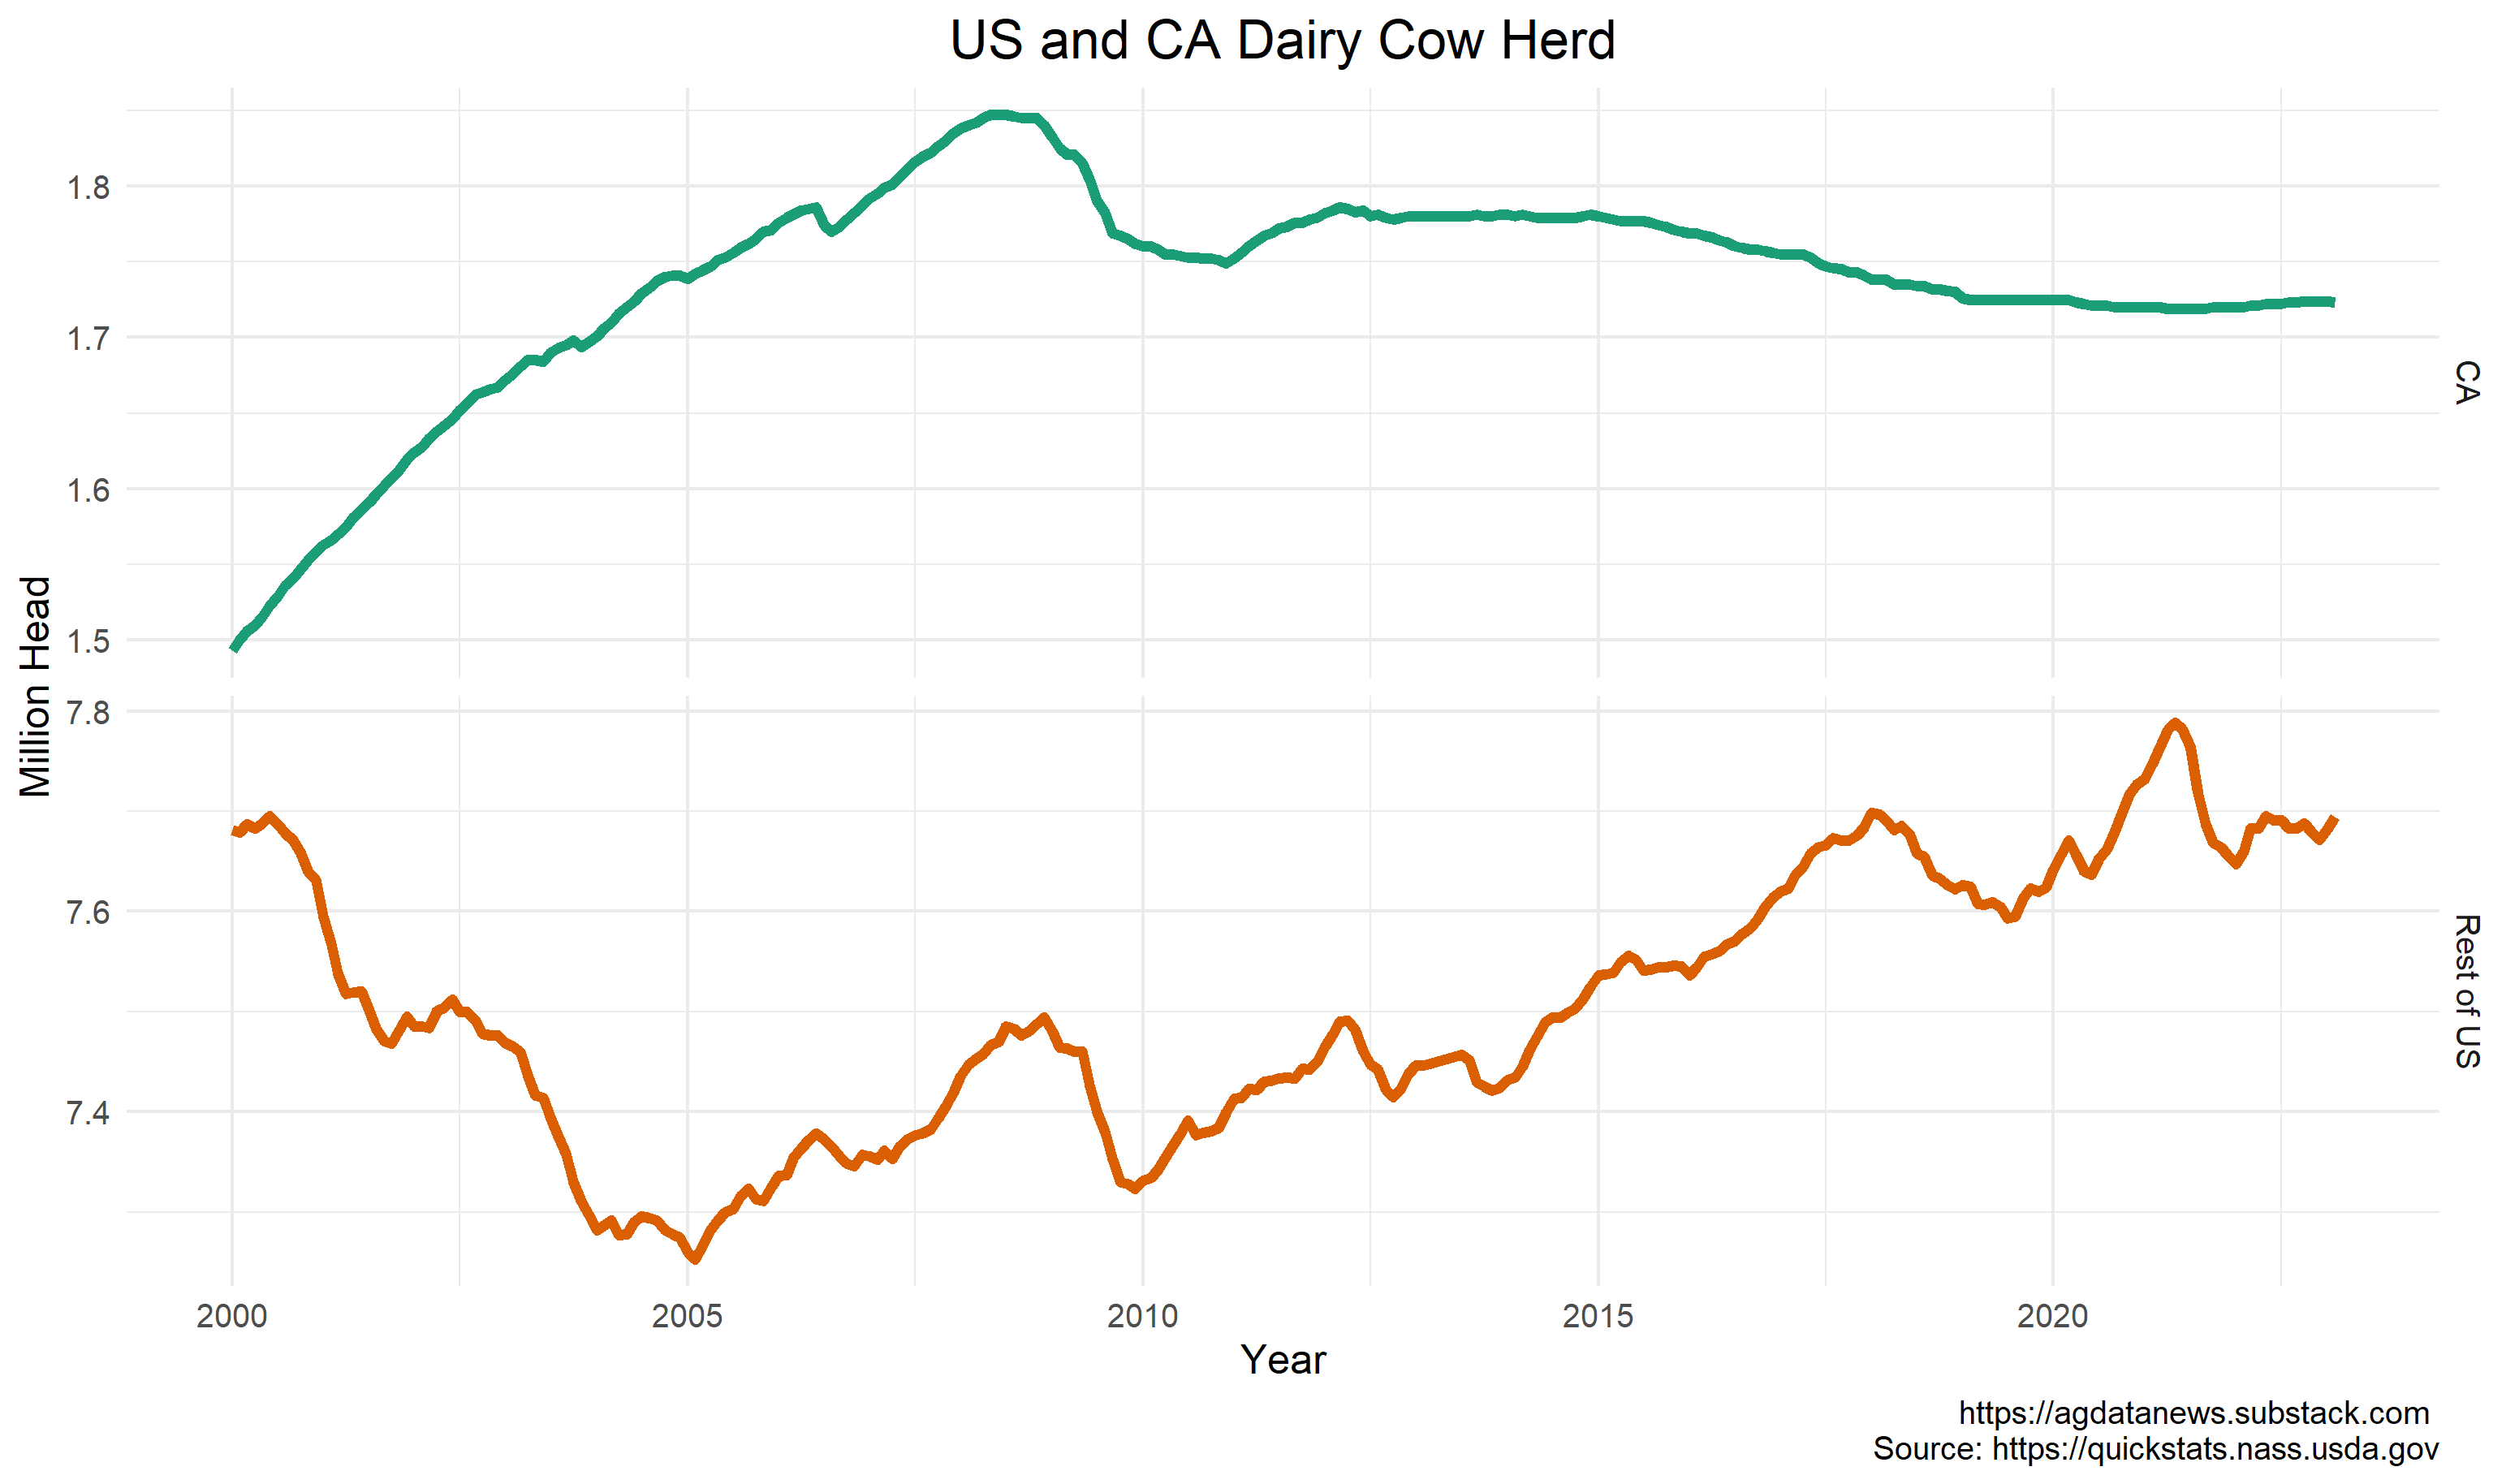
The California dairy herd stopped growing in 2007. In a chapter in the excellent book “California Agriculture: Dimensions and Issues”, my colleague Dan Sumner attributes the growth in the 30 years leading up to 2007 to “climate, topography, and economic openness to create large dairies that provided opportunities for the best farms to thrive by accessing capital, advanced genetics, and exceptional managerial practices.” He notes that the stall occurred when “other regions in the United States adopted much of what had made California distinctive while California farms and processors have grappled with costs of increased environmental, farm labor, and other cost-side pressures.
The Digester Boom
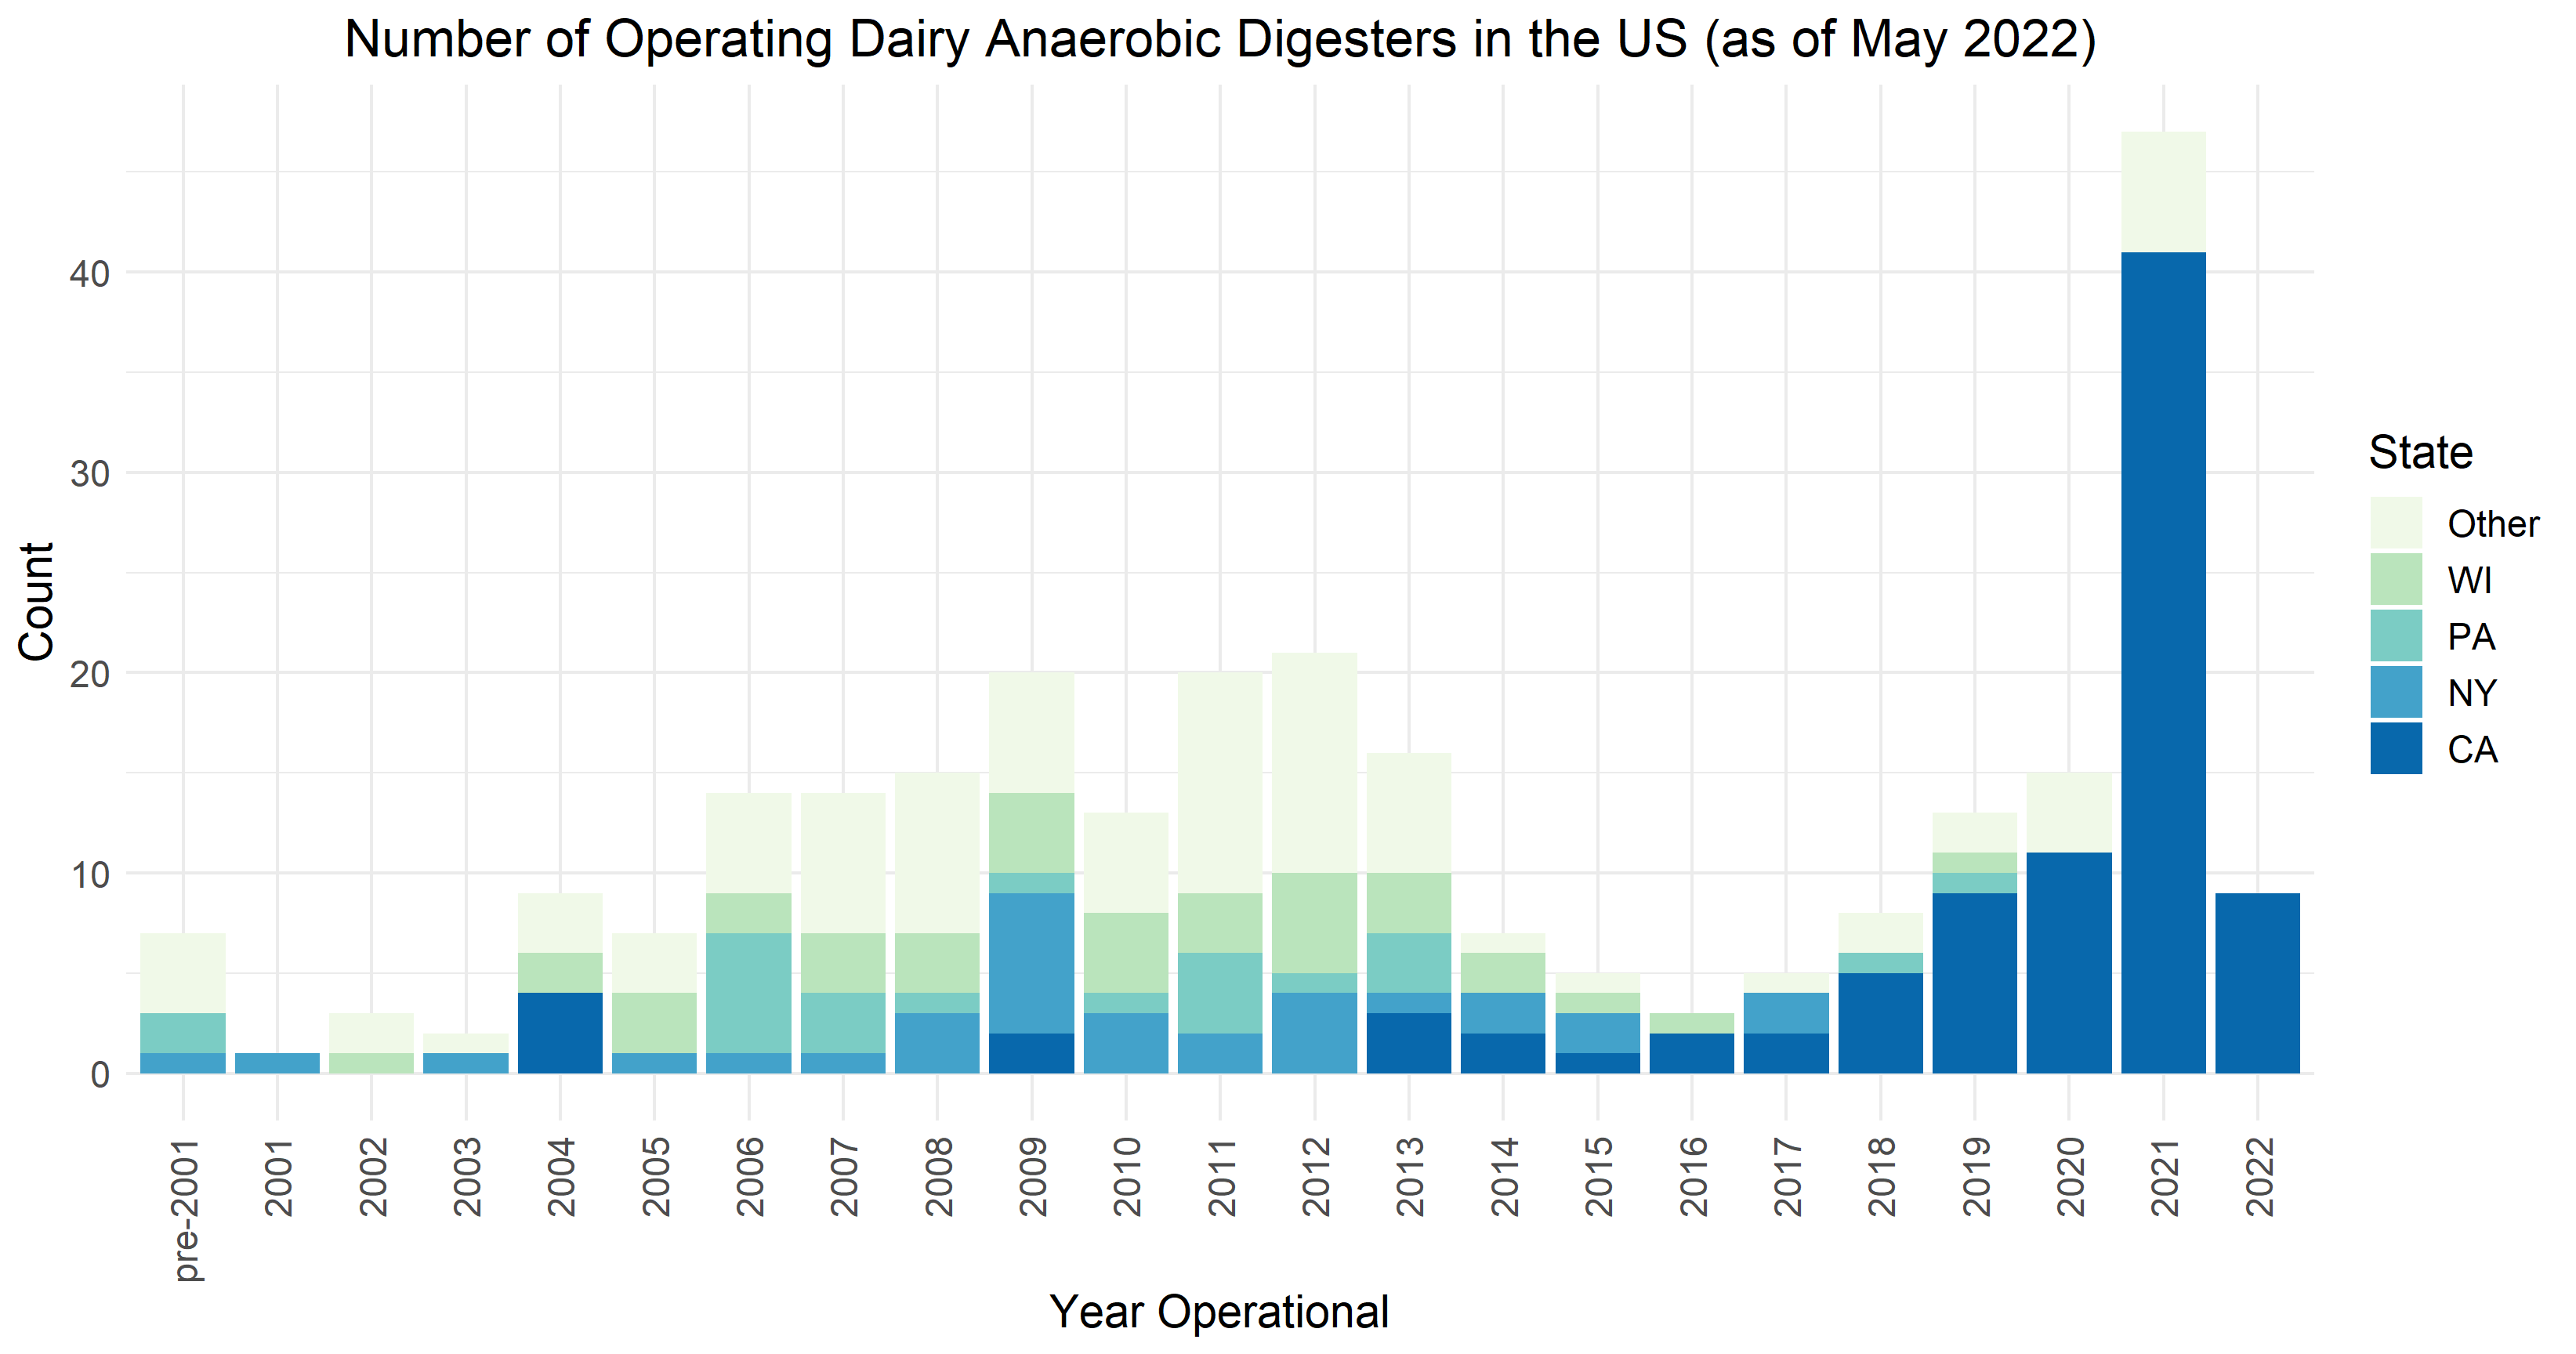
Anaerobic digesters turn cow manure into biogas that can be used in place of natural gas for transportation or electricity generation. The anaerobic digester boom began around 2019, fueled by California’s Low Carbon Fuel Standard (LCFS) program, which offers incentives to capture methane that would otherwise have been emitted from manure lagoons. As of May 2022, 70 of the 91 digesters operating in California had come online since the beginning of 2019.
There are currently an estimated 1,724,000 dairy cows in California, which is 5,000 more than a year ago and 2,000 less in 2019. These changes are very small and well within the margin of error in these data. There is no evidence that the LCFS has caused growth in dairy cow numbers.
Anaerobic digesters are much more cost effective on large farms. It is possible the digester boom has caused consolidation in dairy farms. The number of dairy farms in the state has declined by 50% in the last 20 years, while the number of cows per farm doubled over the same period. Since 2019, the number of cows per California farm has grown slightly faster than it did before the digester boom, which would be consistent with the digester boom spurring growth. However, since 2019 the number of cows per farm has grown at a faster rate outside California than it has in California, which suggests that California digesters are not driving increases in dairy farm size.
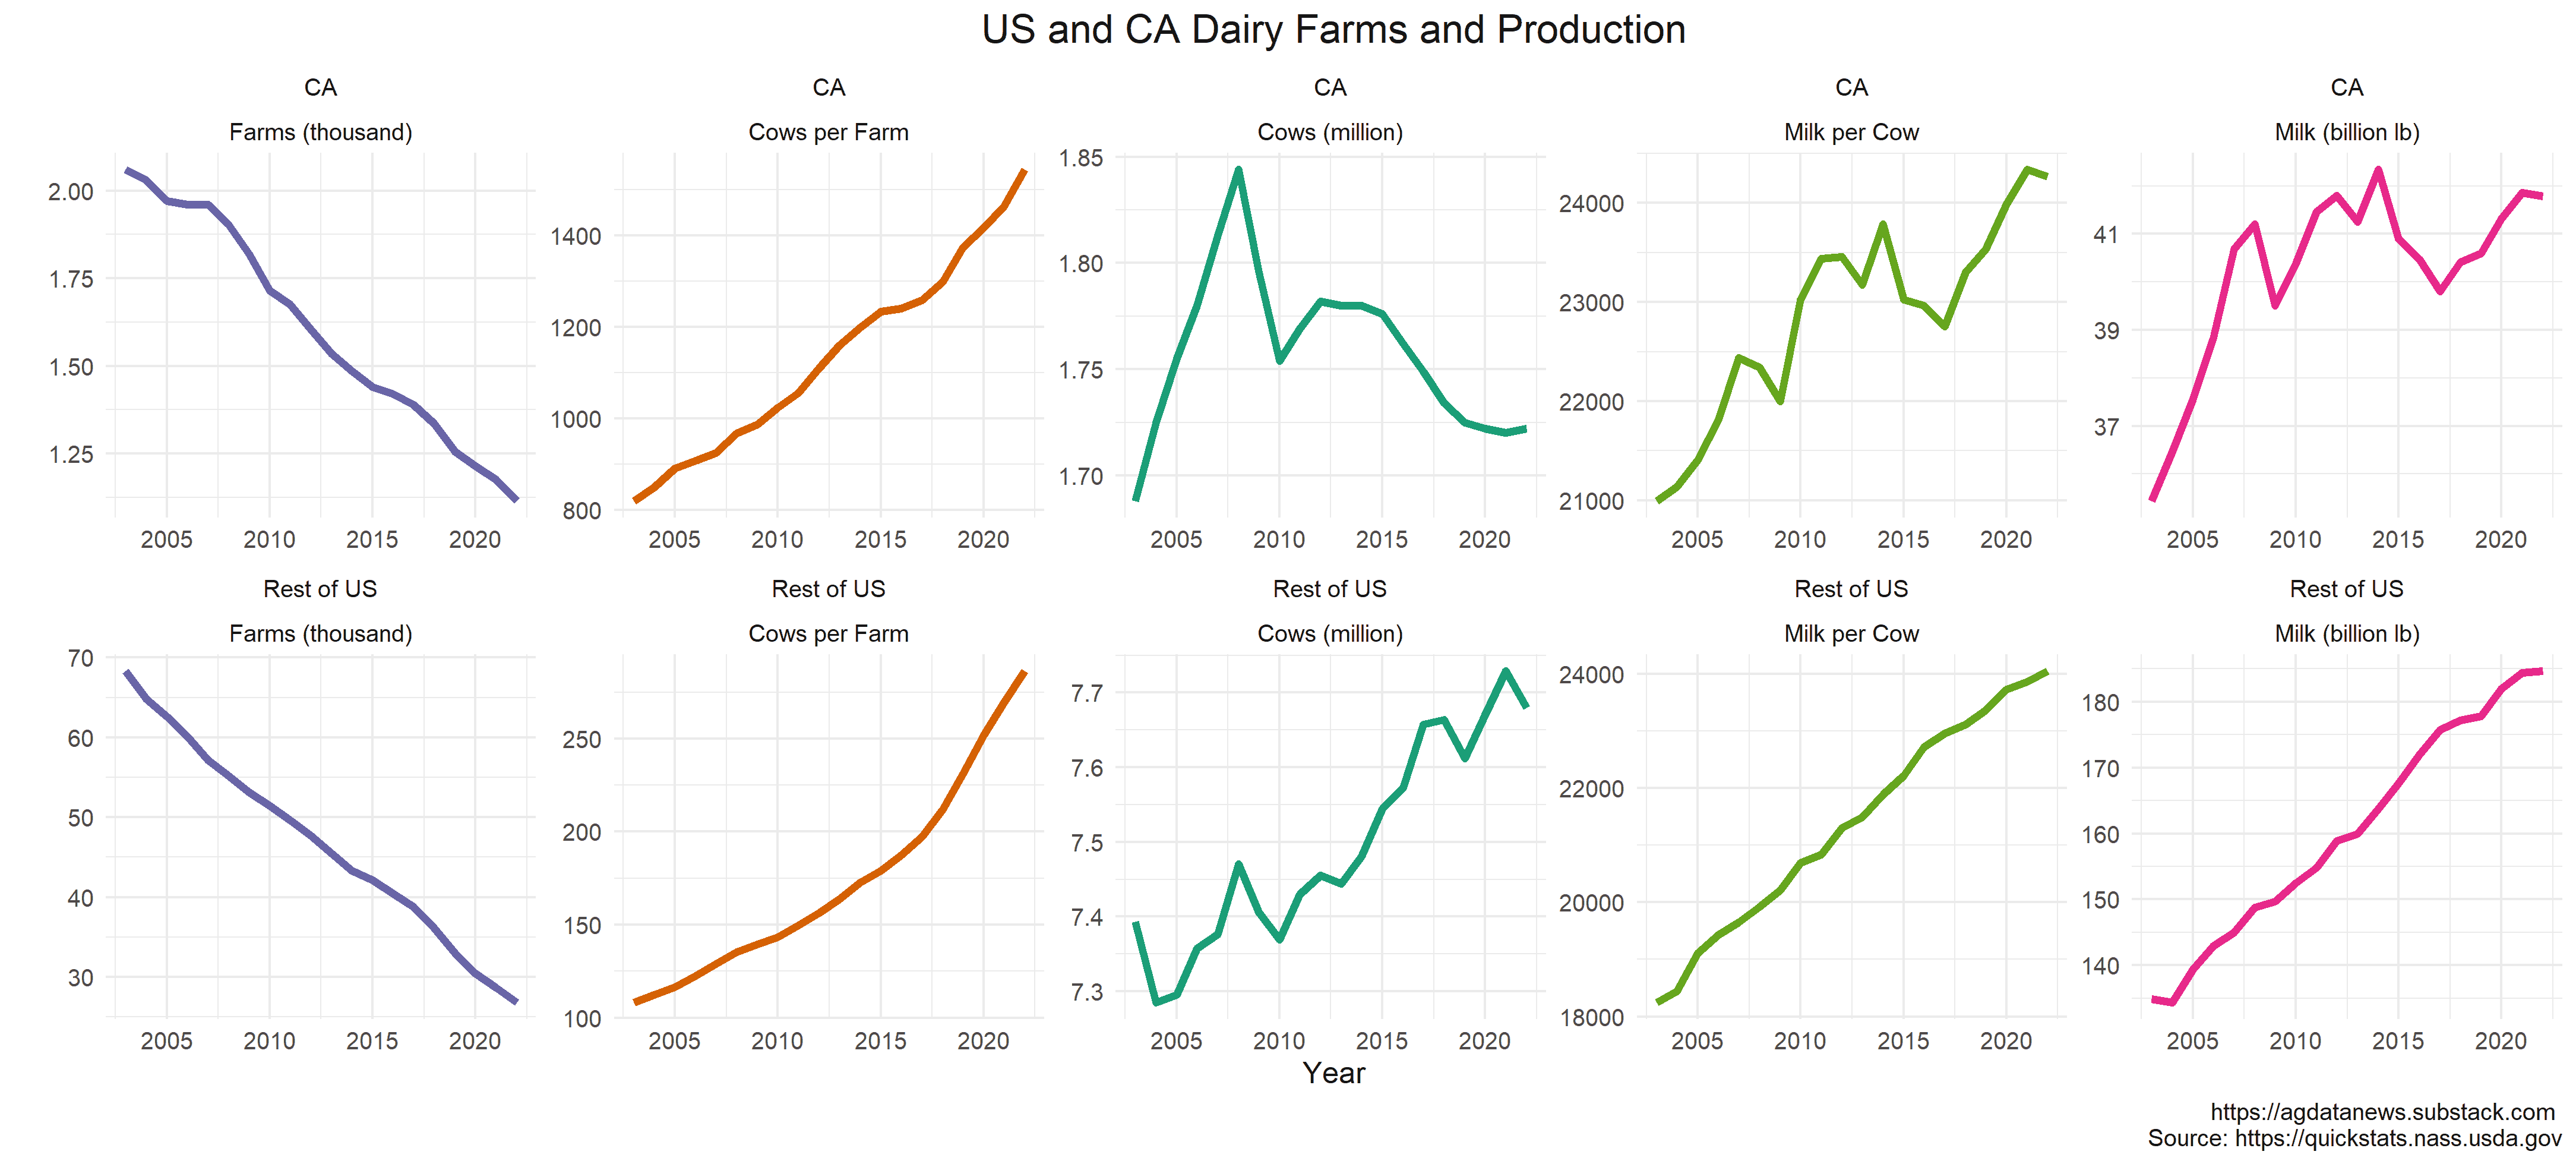
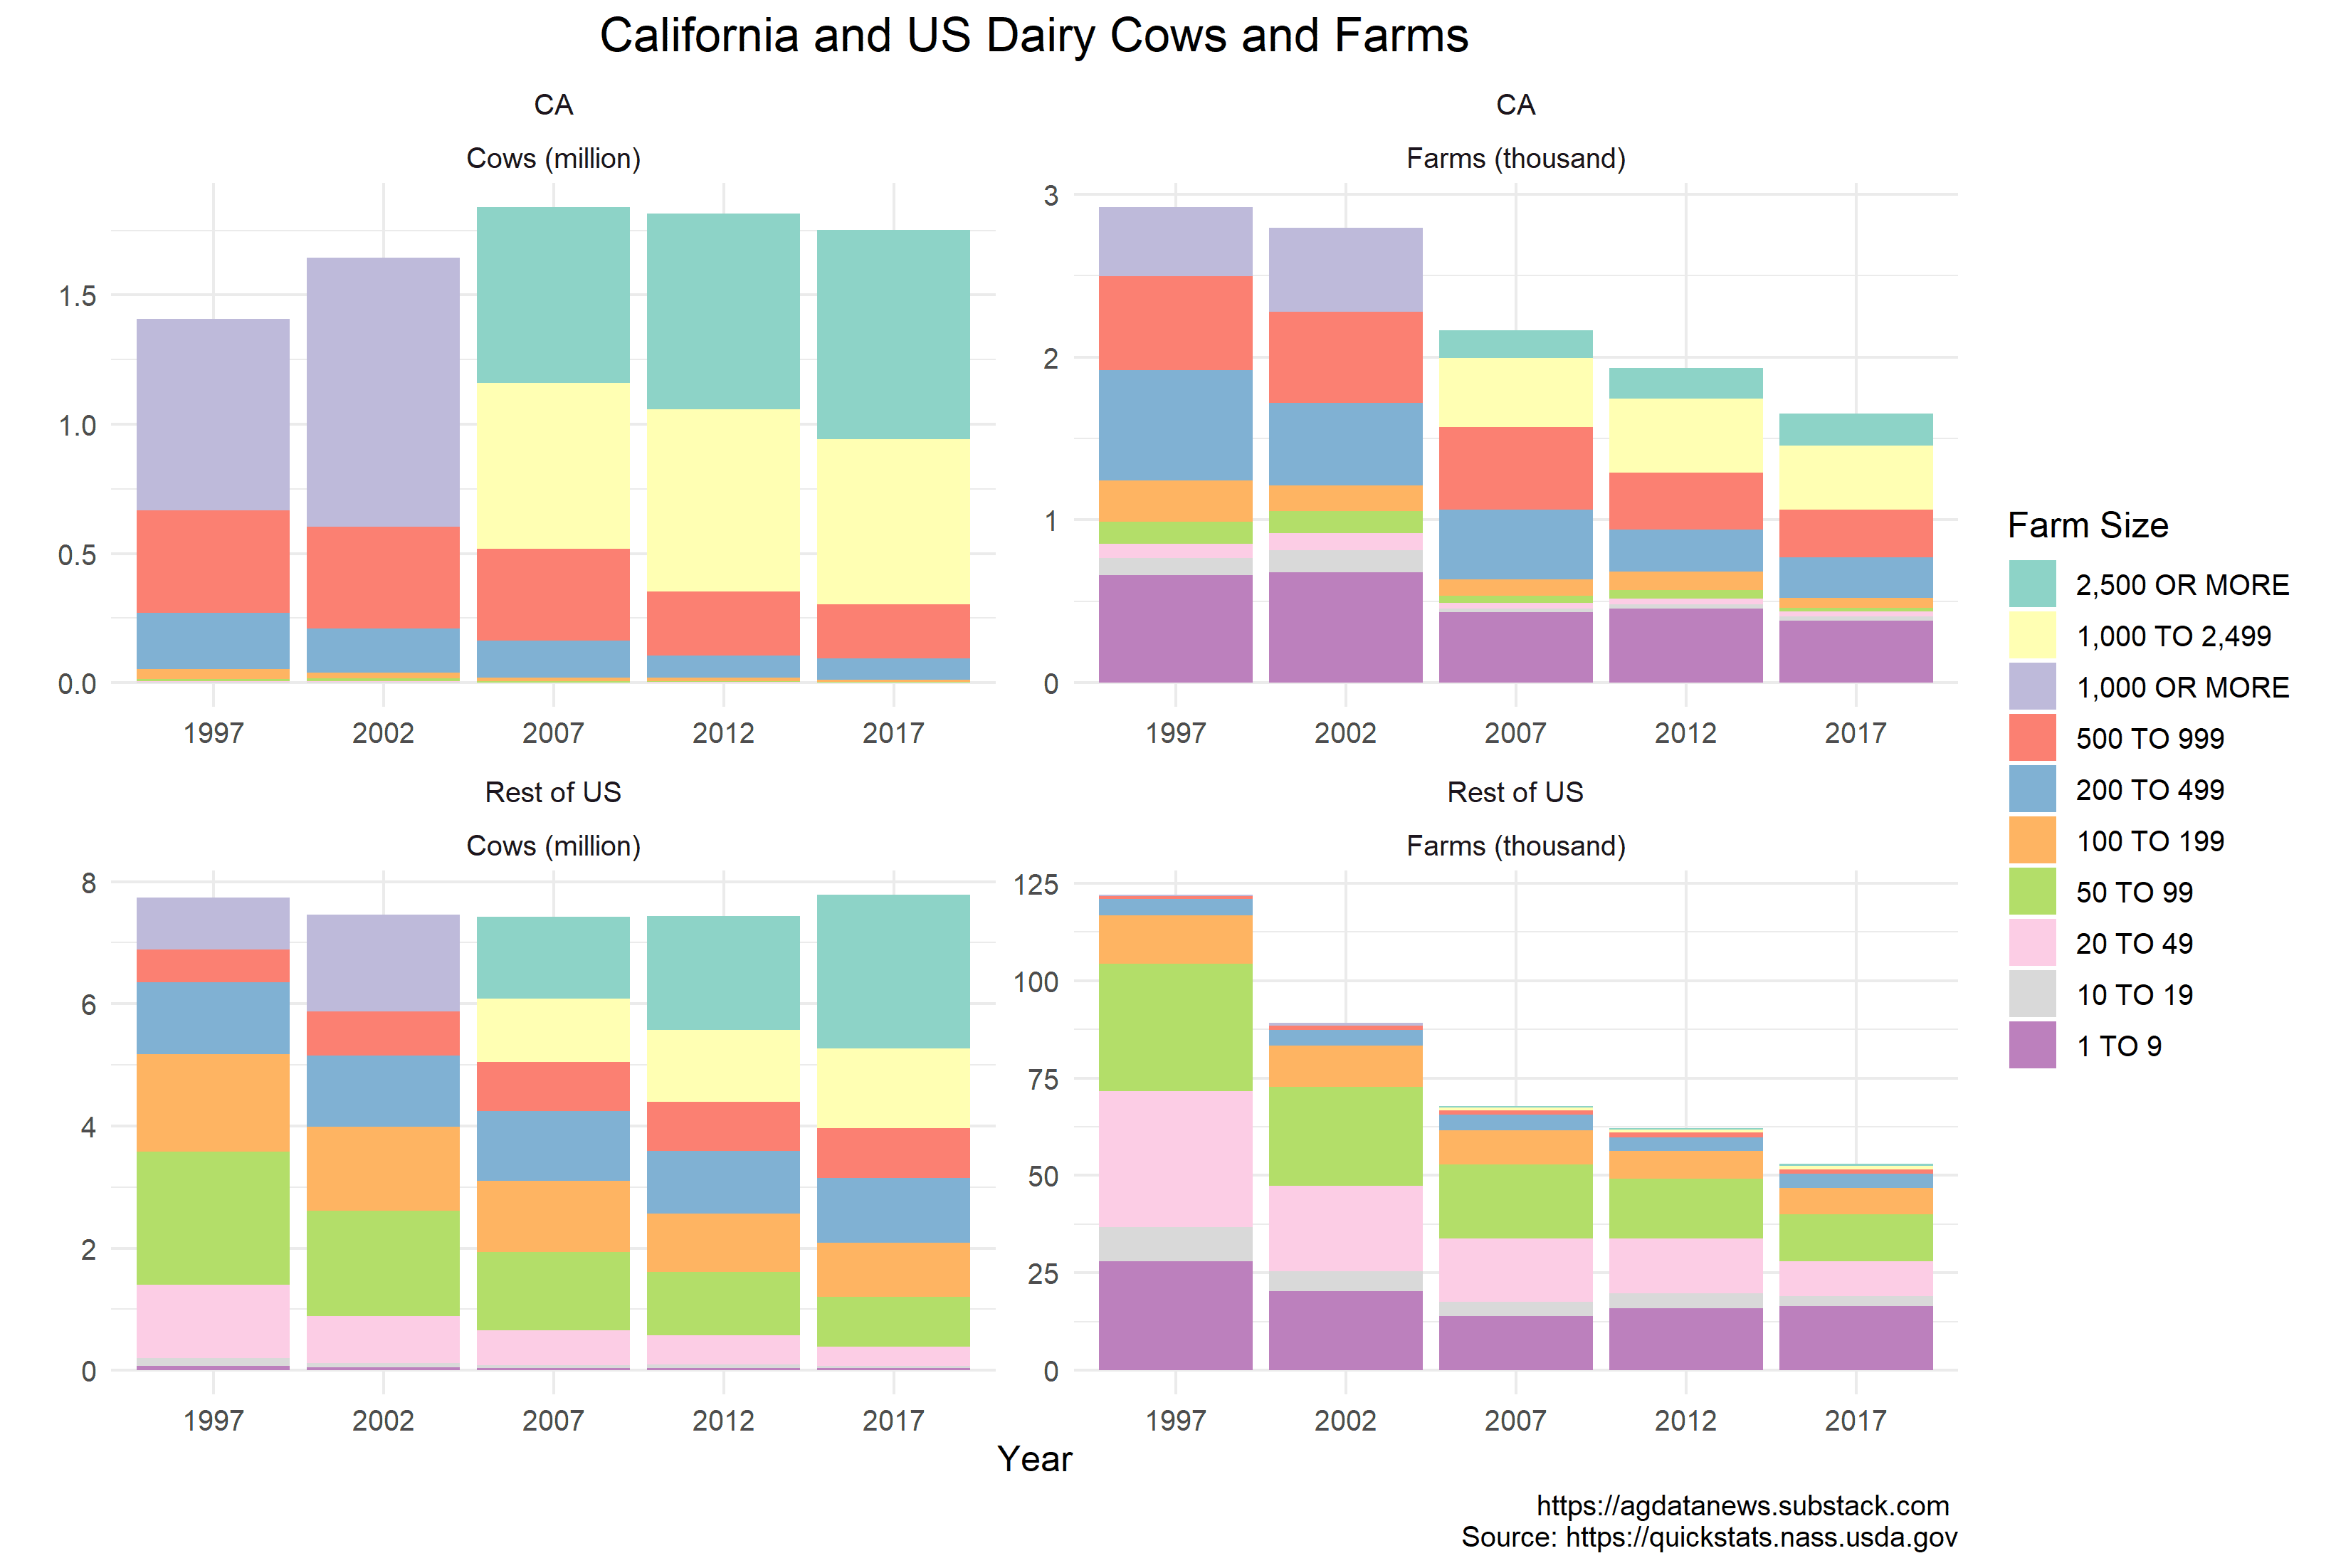
The “Cows per Farm” statistic isn’t perfect because it doesn’t tell us whether California has 1,500 cows on every farm or whether it has 1.7 million cows on one giant farm and 25 cows on each of the other farms. Data from the agricultural census can help us disentangle the distribution of farms, but the census is only taken every five years. Since 2007, the number of California cows on farms with more than 1000 cows has grown from 1.32 million to 1.45 million. The number of farms with fewer than 500 cows has declined markedly both in and out of California.
Data from the 2022 census will enable us to see whether the number of cattle on large farms has increased during the digester boom, but it will not be released until next year.
In colonial India, the British government wanted to reduce the number of cobras in Delhi, so it offered a bounty for dead cobras. Profit-seeking locals responded by breeding cobras to receive the bounty. This phenomenon is known as the “cobra effect”.
There is a risk of the same thing happening when we pay people to capture methane from dairy cow manure. So far, I see no evidence of the cobra effect on California dairy farms, but data from the 2022 agricultural census will shed more light when it is released next year.
I made the graphs in this article using this R code.
