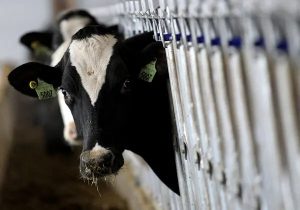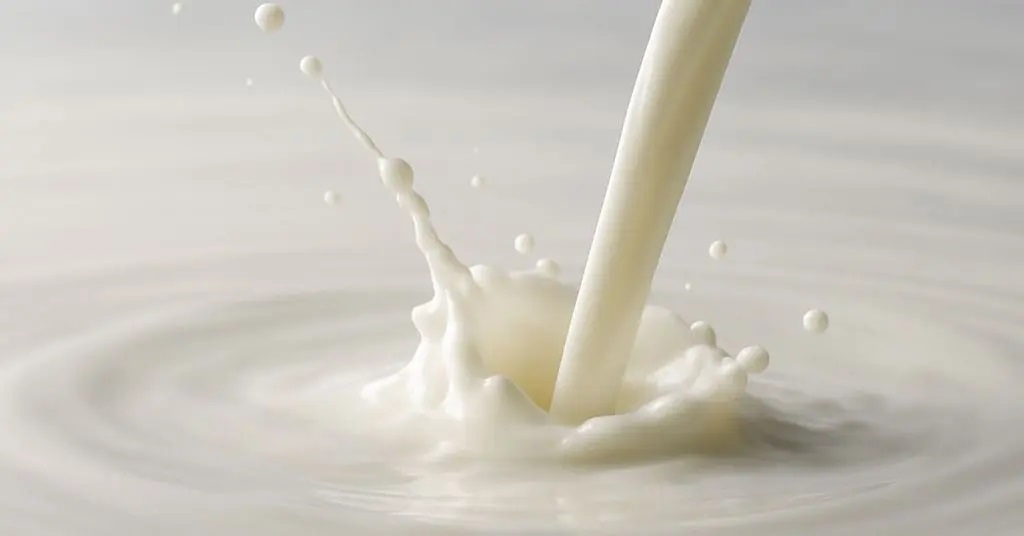

Over the years, as milk moves from the farm to the plant, it increasingly carries less water. This shift is primarily driven by a notable rise in the component level of milk, particularly butterfat.
According to the USDA’s National Agricultural Statistics Service Milk Production Report and Ag Prices Report for the month of May, butterfat levels continue to climb at an impressive rate.
The Numbers Speak
The May USDA Milk Production Report highlighted a slight decline in total milk production, down 0.9% year-over-year. However, the May Ag Prices Report presented a striking contrast: butterfat tests have been on a steady rise. Specifically, the national butterfat average for May 2024 reached 4.17%, a significant increase from the previous year’s average of 4.06%.
Isaac Salfer, an assistant professor of dairy nutrition at the University of Minnesota, provides some historical context to this trend.
“A good milk fat benchmark for a Holstein herd was previously around 3.75%,” Salfer states.
This benchmark was historically supported by milk market data, which showed average butterfat tests in the Upper Midwest fluctuating between 3.7% and 3.8% from 2000 to 2012. However, by 2021, we witnessed a rapid increase in milk fat levels, with the Upper Midwest averaging over 4.0% for the first time ever.
4 Driving Factors that Increase Butterfat
Salfer attributes this rise in milk fat to four main factors:
1. Improved Ration Formulation – The emphasis has shifted towards feeding rumen-protected fatty acid products and enhancing fatty acid digestibility.
2. Enhanced Forage Quality – Higher fiber digestibility permits feeding more fiber-rich diets without compromising the energy available for milk production.
3. Better Feed Management – Optimizing cows’ time at the feed bunk through improved feed and bunk management techniques.
4. Genetic Selection – Enhanced genetic selection for milk fat percentage, especially using the Net Merit $ selection index, which prioritizes milk fat and protein yield.
Economic Implications
As dairy producers review each line item on their milk check, they might notice a significant benefit that comes from having strong milk components. These components significantly add value to each hundredweight of milk produced.
Erick Metzger, the general manager of National-All Jersey, highlights that over 80% of the U.S. milk is utilized in manufacturing products.
“Because these products are so dependent on milk components, it is crucial for producers to understand and keep track of the volumes of components produced each month,” he says.
You can now read the most important #news on #eDairyNews #Whatsapp channels!!!
🇺🇸 eDairy News INGLÊS: https://whatsapp.com/channel/0029VaKsjzGDTkJyIN6hcP1K