Trade is very important to production agriculture in the United States. Over the last 12 years, 2011 to 2022, agricultural exports have accounted for over one-third of U.S. gross farm income, 33.9% (USDA ERS and FAS).

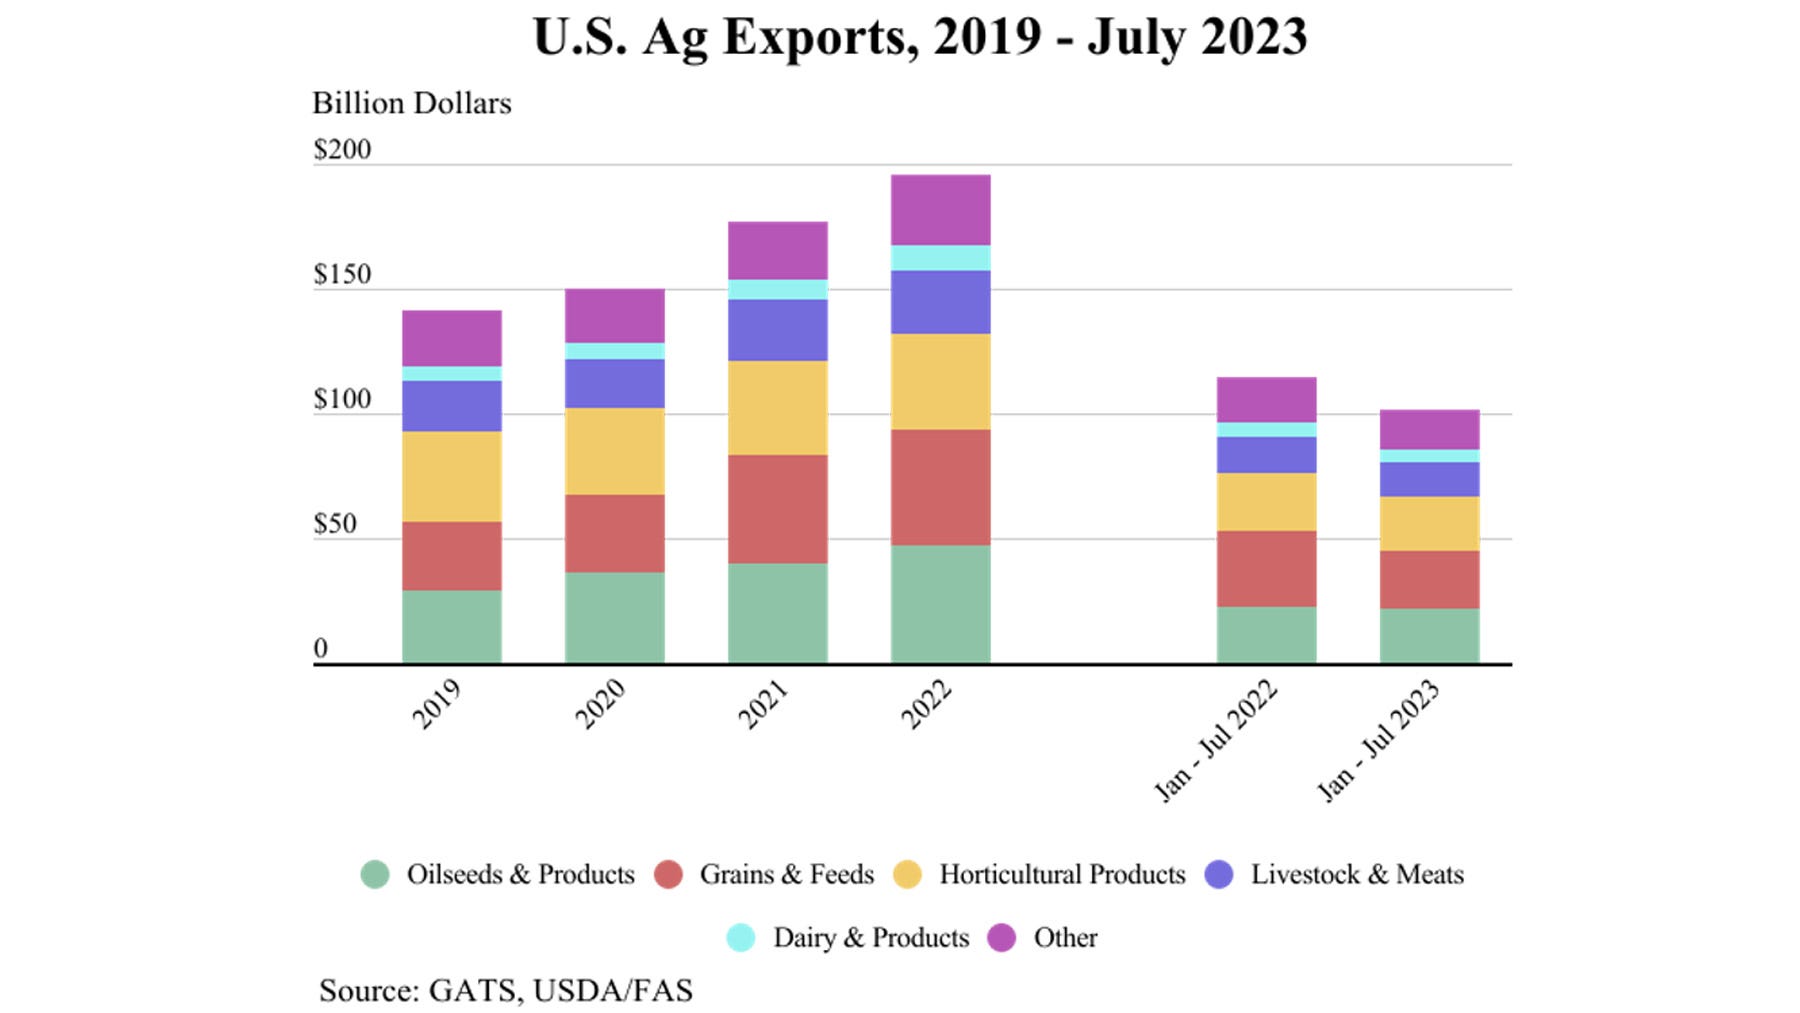
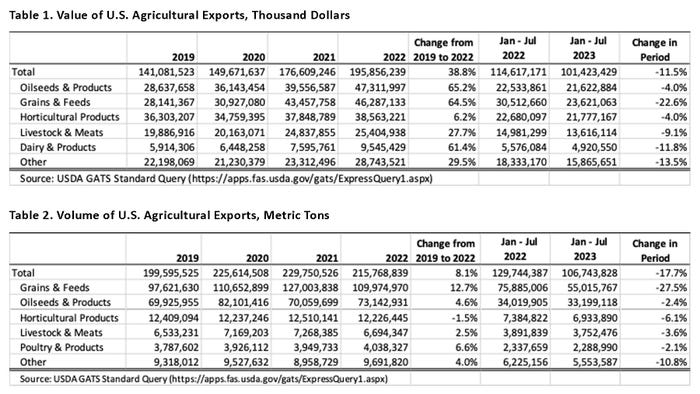
U.S. agricultural exports have experienced a seven-year expansion run from 2015 to 2022, going from $137.2 billion to $195.9 billion. This increase of U.S. agricultural exports was accentuated during the COVID-19 pandemic years as total exports increased by 38.8% in value and 8.1% in volume between 2019 and 2022 (Tables 1 and 2).

The large difference between value and volume increases shows that there was a price increase in most of the commodities which can be attributed partially to an increase in quantity demanded of U.S. agricultural products, but also to inflation experienced worldwide as well as the Russia-Ukraine war. The largest increase in value of the top five U.S. agricultural exports from 2019 to 2022 are oilseeds and products, grain and feeds, and dairy and products with 65.2%, 64.5%, and 61.4% increases, respectively. Moreover, in terms of volume, grains and feeds, poultry and products, and oilseeds and products have the largest increase with 12.7%, 6.6%, and 4.6% respectively.
The latest USDA Outlook for U.S. Agricultural Trade report (August 2023) forecasted 2023 exports at $177.5 billion, down $3.5 billion from the May forecast largely due to decreases in corn, wheat and tree nuts exports.
The year-over-year exports, from January to July, show an overall decrease of 11.5% in value and 17.7% decrease in volume (Tables 1 and 2). In both, value and volume, the largest decreases are in grains and feeds with 22.6% and 27.5%, respectively. The main reason for this decline is competition from Brazil, EU, and Russia. Moreover, forecasted exports for 2024 are expected to be $172 billion, $5.5 billion below 2023, and $23.9 billion below 2022 exports.


