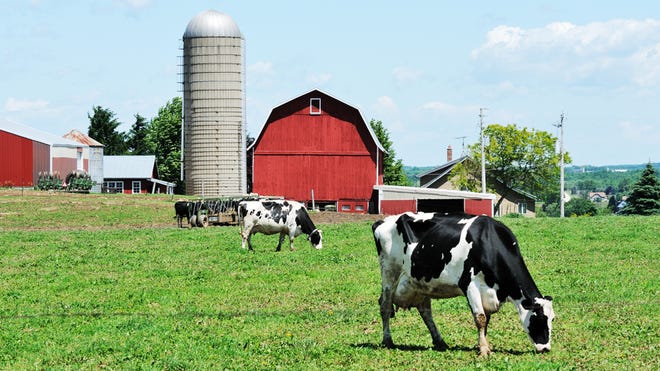
After many years of depressed prices, some dairy farmers faced an extremely tough year as the industry struggled with a global pandemic, negative Producer Price Differentials and Federal Milk Marketing Order de-pooling while others enjoyed near record milk prices due to volatility in cheese prices.
This year-over-year decline in the number of dairy operations continues a long trend of farmers deciding to exit the dairy business. Since 2003, the U.S. has lost more than half of its licensed dairy operations, now just shy of 32,000 dairy operations.
Dairy Herd and Milk Production
U.S. dairy farmers enter 2021 still in a state of flux following the disruptions caused by COVID-19 throughout 2020 and uncertainty on how new food assistance programs may impact milk and dairy commodity prices. USDA’s Milk Production report showed that annual milk production in the United States in 2020 was 223 billion pounds, increasing just over 2% from the 218 billion pounds produced in 2019.
In early 2020, the dairy price environment was very favorable, and despite the craziness of the pandemic, milk-feed price ratios throughout much of 2020 were favorable for dairy herd expansion. However, the rising price of corn and soybean meal prices that began in late 2020 are likely to carry through 2021 as higher feed prices, which will be particularly tough for milk producers as milk prices are trending lower.
While the total milk cow inventory at the end of 2020 was the highest since 1995, herd expansion is likely to stop this year and the cow inventory could potentially decline. In addition to a higher cow inventory at the end of 2020, the January cattle inventory report showed a decline in heifers being retained for milk cow replacement. The replacement heifer as a percentage total milk cows rate sits at 48.8%, the lowest level since 2009.
Dairy cow slaughter numbers did not significantly spike recently, meaning that the likely milk cow inventory decline will be driven by fewer additions through replacement heifers rather than liquidation of the current herd.
One thing to keep in mind when looking at milk production is the ever-increasing productivity of the milking cows. Milk produced per cow in the U.S. averaged 23,777 pounds for 2020, 382 pounds above 2019’s 23,395, marking a strong year-over-year gain. Unlike the fluctuating overall number of cows, milk production per cow has steadily increased approximately 11.5% from 2011. In 2021, USDA predicts that daily output per cow will increase nearly 1.7%, which would be the highest rate of growth since 2014.
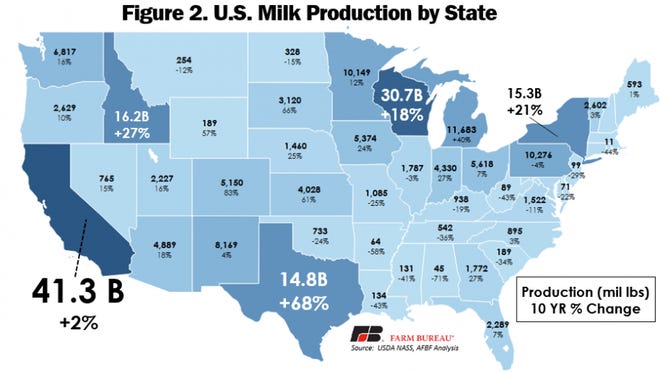
California is the largest milk-producing state in the U.S., clocking in at 41.3 billion pounds. The state is followed by Wisconsin at 30.7 billion pounds. AFBF
California is the largest milk-producing state in the U.S., clocking in at 41.3 billion pounds. The state is followed by Wisconsin, Idaho, New York and Texas, with 30.7 billion, 16.2 billion, 15.3 billion and 14.8 billion pounds, respectively. Growth in production over the past decade has not been evenly distributed.
While production has grown in most of the country, since 2010 it has declined in certain regions, such as much of the Southeast. Colorado has experienced the largest growth in percentage terms, growing 83%, albeit from a smaller base production number. Milk production in Texas has increased 68% since 2010, pushing the Lone Star State into its current position as the fifth largest milk-producing state in the country.
Decline of Licensed Dairy Herds in the U.S.
This Milk Production report also showed the fourth-largest year-over-year decline in the number of licensed dairy operations in the last 15 years, and the second-largest (right behind 2019) year-over-year percentage decline since 2003, the first year for which the data is available. There were 2,550 fewer licensed dairy operations in 2020 than in 2019, when the number dropped by 3,261.
The overall number of licensed operations in the U.S. has marched steadily downward since data collection began, declining by more than 55%, from 70,375 in 2003 to 31,657 in 2020. The last three years of data show larger year-over-year declines than any other decline in the last 13 years. This recent acceleration of the decline reflects how difficult it is to operate a dairy in a low milk price environment. Since the end of 2014, dairy farmers have struggled with low prices followed by an industry-disrupting pandemic that increased milk price volatility and rendered risk management tools mostly ineffective.
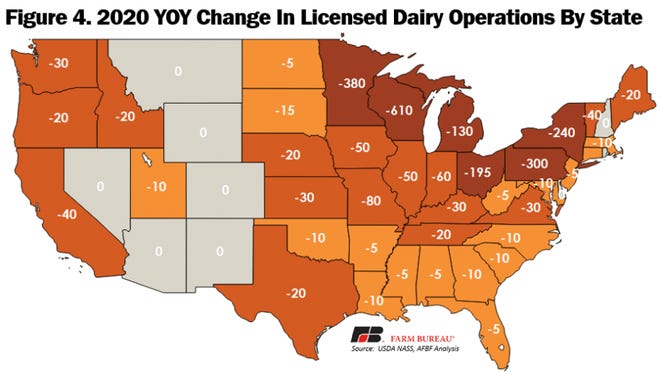
In terms of the decrease in the number of licensed operations, Wisconsin led the country with 610 fewer operations in 2019 than a year earlier.
No state registered an increase in licensed dairy operations from 2019 to 2020. In terms of the decrease in the number of licensed operations, Wisconsin led the country with 610 fewer operations in 2019 than a year earlier. Following Wisconsin was Minnesota, Pennsylvania, New York and Ohio, with declines of 380, 300, 240 and 195, respectively.
The Upper Midwest and the eastern Corn Belt lost the most licensed dairy farms. The loss of licensed dairy farm operations during 2020 closely aligns with Chapter 12 farm bankruptcies – especially in Wisconsin, Minnesota and in the Northeast (Farm Bankruptcies During 2020).
Summary
U.S. dairy farmers enter this year still in a state of flux following the disruptions caused by COVID-19 throughout 2020. Uncertainty remains as to how future food assistance program will impact milk price volatility in 2021. NASS’ most recent monthly Milk Production report showed yet another decline in the number of licensed dairy operations in the U.S., and one of the largest year-over-year percentage declines registered since 2003, when the data was first collected.
After many years of dealing with depressed prices, many dairy farmers faced an extremely tough year as all of agriculture struggled in dealing with a global pandemic. This year-over-year decline in the number of dairy operations continues a long trend of dairy farmers deciding to sell the cows and close the barn doors.
