“Only 6% of Indian farmers benefit from minimum support prices (MSP)”. So widely-quoted is this figure — especially in the context of the recently-passed Farmers’ Produce Trade and Commerce (Promotion and Facilitation) Act — that it has become a factoid or even truism.
What is, isn’t counted
The apparent source of the 6% figure is the Shanta Kumar-headed High Level Committee on Restructuring of Food Corporation of India (FCI). Its report, submitted in January 2015, had noted that only 5.21 million of the country’s total estimated 90.20 million agricultural households in 2012-13 had sold paddy and wheat to any government procurement agency. In other words, less than 5.8%. The committee, in turn, based its analysis on the National Sample Survey Office’s (NSSO) ‘Key Indicators of Situation of Agricultural Households in India’ report for the 2012-13 farm year (July-June).
The Shanta Kumar panel, however, looked only at paddy (un-milled rice) and wheat. While much of public procurement is, no doubt, limited to these two cereals — the 76.49 million tonnes (mt) of paddy and 38.99 mt of wheat bought by FCI and state agencies in 2019-20 was worth almost Rs 215,000 crore at their respective MSPs — one must also take into account other crops.
The accompanying table provides data on procurement of major crops during 2019-20: Paddy/rice and wheat by FCI; chana (chickpea), arhar/tur (pigeon pea), moong (green gram), groundnut and rapeseed-mustard by the National Agricultural Cooperative Marketing Federation of India (NAFED); and cotton by the Cotton Corporation of India. It also includes milk procurement by dairy cooperatives, which are largely quasi-government organisations that pay assured prices to farmers even if not technically MSP. Their collection averaged 507.69 lakh kg per day or 18.53 mt annually in 2018-19.
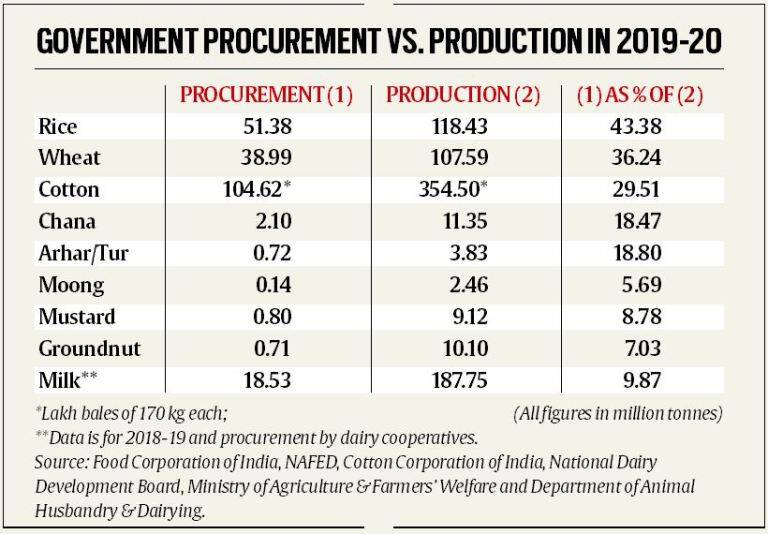
It can be seen that the procurement of these crops is not at all insignificant relative to their estimated production. The ratios are from 29.5 per cent to over 43 per cent for paddy/rice, wheat and cotton, 18-19% in chana and arhar/tur, 10% in milk, and 7-9% in mustard and groundnut.
The above percentages would be even higher if calculated against actual sales by farmers. Take milk, where the government’s production estimates themselves are probably on the higher side. But even assuming the 187.75 mt output figure for 2018-19 to be right, not more than half of it (say, 90 mt) would constitute marketable surplus after self-consumption by farm households. The ratio of cooperative procurement — for which there is authentic data from the National Dairy Development Board (NDDB) — will be at least a fifth of the marketable surplus of milk.
Milk apart, sugarcane is another crop not procured by government agencies per se. Cane prices are, nevertheless, fixed by the government, with sugar mills legally obliged to pay the Centre’s fair and remunerative price (FRP) within 14 days of purchase. They buy roughly 80% of the total crop produced. The FRP value of cane crushed by them in the 2019-20 season (October-September) alone was Rs 75,585 crore.
An underestimate
How does all this, then, square up with the “only 6% of farmers get MSP” theory? The answer is that this oft-repeated number is clearly an underestimate. It is so even if one were to consider only paddy and wheat.
According to the earlier-mentioned NSSO report, 44.84 million or nearly half of India’s estimated 90.2 million agricultural households cultivated paddy during July-December 2012 and another 8.46 million in January-June 2013.
Besides, 35.23 million (39%) grew wheat that year. If 43.4% of India’s rice/paddy output and 36.2% of wheat was actually procured by government agencies, it is obvious that the MSP benefits would have accrued to far more than the 5.8% figure in the Shanta Kumar committee report. The Food Ministry’s own data shows that 11.06 million paddy and 4.06 million wheat farmers benefited from MSP procurement in 2019-20. Even after eliminating double-counting (Punjab and Haryana farmers cultivate both crops), they would add up to 13-13.5 million, which is way above the Shanta Kumar panel’s estimate of 5.21 million.
One can extend the analysis to other crops as well. The NSSO report has estimated the total cotton-growing households at 7.55 million and that of sugarcane at 6.2 million. Up to 10 million of them may have availed of either MSP or FRP. NDDB’s 2018-19 Annual Report has placed the total producer-members of dairy cooperatives at 16.93 million. Even if half of them aren’t regular pourers, there would still be 8 million or so farmers today selling milk at a minimum assured price. The presence of cooperatives, moreover, ensures that private dairies pay closer to the formers’ rates.
All in all, it can be reasonably inferred that the existing MSP/assured price system covers 25 million-plus farmers across all crops, including pulses and oilseeds. Depending on the denominator – the 2015-16 Agriculture Census puts the total number of operational holdings at 146.45 million – that translates into anywhere between 15% and 25%. Certainly, not 6%.

