I’ve never been a great fan of Mike Joy’s style. To me he lets his personal bias (anti-dairying) come to the fore a mite too much for my preference. Having said that, New Zealand needs people like him and Forest and Bird etc. to hold us to account and act on behalf of those that can’t – in this case, ecological systems.
The original research ‘paper’ is 25 pages and so takes a bit to digest. However, as dairying is such a critical component of the New Zealand economy, especially at the moment, and I’m living in the midst of it in Selwyn Council District in Canterbury, I felt a need to give the research a reasonable go at critiquing.
The research analyses the consumption of rainwater (green Water Footprint [WF]) and groundwater or surface water (blue WF) needed to dilute pollutants produced as a result of a product’s manufacture. In this case required to dilute by flushing the aquifer of nitrates.
There was a range of levels of dilution applied because, as we’re starting to have to accept, the WHO standard of 11.3mg/l is really questionable whether or not can be considered safe both for drinking and for ecological values.
The now well-known Danish study believes anything over 0.87mg/l of N greatly contributes to the incidence of colorectal cancer after long term exposure and even lower N levels at .44mg/l are the trigger level for impacting upon ecological values. The media focused heavily on the worse (or ‘best’, depending upon your world view) figure of the water required to dilute down to 0.87mg/l.
According to the study this was assessed at 1,150,000 litres. To get or stay within the WHO bounds of 11.3mg/l a lesser amount of 88,500 litres is required. In my view the researchers use of only dairy land’s area as the rainfall catchment was a flaw in the project as the aquifers in Canterbury are considered ‘unconstrained’ and so are a catchall of the all the water that falls on the plains and beyond.
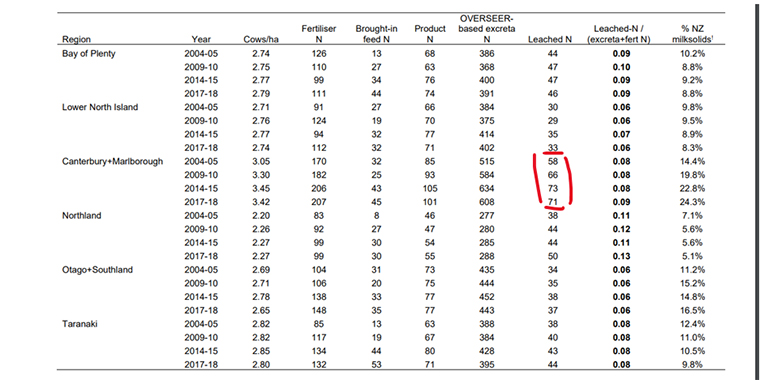
I did my figures on 3 million hectares (total Canterbury Plains area) with an average rainfall of 750ml per annum. My numbers for cows and milk volumes were very similar to theirs although I initially believed that their use of 69kgs of N leached per hectare was on the high side until I got a recent table from an MPI publication which reinforced that number. (See below with the “Leached N” being the number of interest).

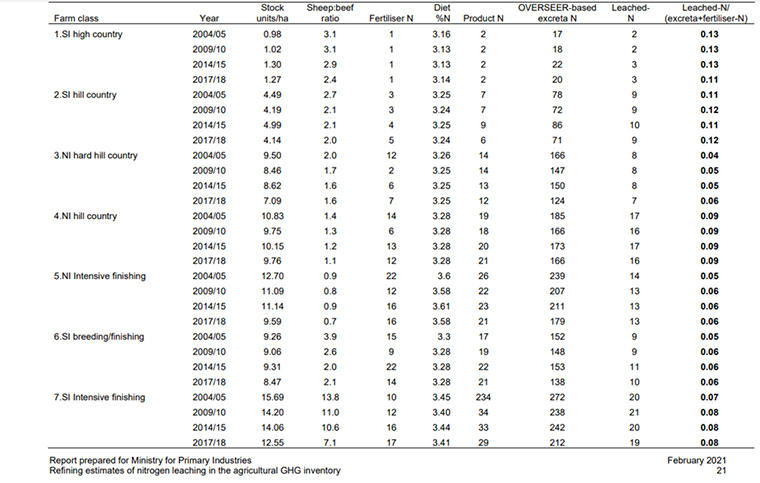
At this stage it is perhaps useful to look at other land-uses and N leaching from them. Below is the averages from sheep and beef farms.
Finally, arable crops over an average season.
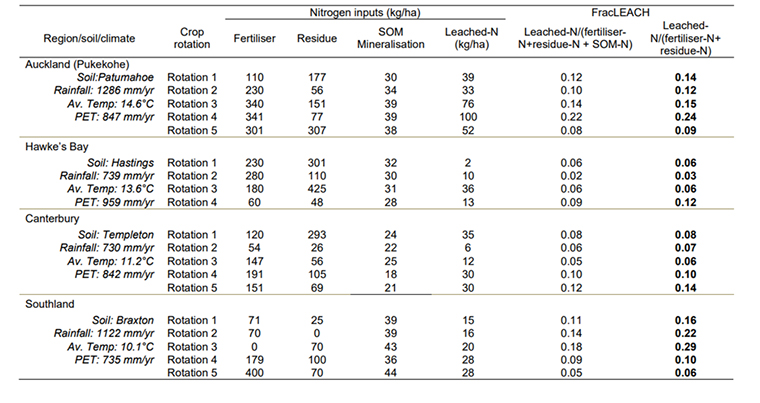
What concerned me was that the latest dairying data used was 2018 and there seems to be little published information of what more recent data would like. A consultant at the cliff face of conducting Overseer© monitoring said he thought most Canterbury farms would fall into the 40-70kgs per ha of N leached to water. Not too far from the MPI and Mike Joy’s number.
Unfortunately, even using the 3 million hectare catchment figure didn’t do much to change the gist of the research. It provided 4,500 litres of water per litre of milk produced, still a long way from what is required to flush out the aquifers. As can be seen Westland dairy exceeds even Canterbury’s numbers, but with the higher rainfall, proximity to the ocean and lower population, it has avoided more intense scrutiny.
Canterbury has long recognised it has a major issue with water, as do most intensively farmed regions. The Regional Council (ECan) brought in stricter criteria to start to mitigate against the problem and rising public concerns back in 2010.
N levels were capped to the 2009-10 year which effectively stopped any more dairy conversions taking place unless the land already had a high N history or was part of a district irrigation scheme.
Last year nitrogen applications were capped at 190kgs per ha and farmers were required to adhere to best practice to work towards making dairying more sustainable.
Among all this, ECan brought the desired maximum level of nitrates in the aquifers drinking water down from 11.3mgs/l to 2.6mg/l (a compromise figure). Already many Canterbury wells are above this level and many in the public would like to see it lower still.
The Government is going to review the National Water Policy in 2023. Given the relatively short time frames since any (arguably) meaningful policy has had to influence water quality I can’t see much short-term change. The fact that it takes time for N to travel through the ‘soils’ to get to the aquifer where its impact can be measured does provide some breathing space for dairy farmers.
However, a summary in the latest Irrigation News magazine, of a paper published in Nature Journal Scientific Reports (August 2021), has found in New Zealand that it takes on average less than 5 years for nitrates “to travel from farm to river”. The range was from one to 12 years, with sloping land being the longest.
This time frame I believe is less than many in Canterbury have believed in the past and at this rate (5 years or less) we should be seeing improvements now or certainly soon.
The fact the farm per hectare rates of N leaching are still high (if improved) means that we are clinging to straws if we believe we are going to see any real improvement in the foreseeable future.
One of the frustrating things for those on the sidelines is the knowledge that there are systems which can be incorporated and have a large impact on nitrate leaching as Keith Woodford has highlighted several times, but despite record payouts there still appears little uptake. ECan has a part to play with more regular monitoring and publishing of data of the state of the Canterbury aquifers to keep a focus on what the real situation is, good or bad. At the moment what little information that comes out is thin and far between.
Mike Joy’s research concludes with a view that if something dramatic does not happen soon then …
“Dairy farming will result in steady state nitrate concentrations on average of 21.3 mg NO3–N/L in groundwater originating from dairy farming areas in Canterbury, rendering much of it undrinkable. The groundwater drinking water supply of Christchurch, the second largest city in New Zealand, will also become significantly polluted with nitrate from dairy farming in the Waimakariri River catchment, and the current deep aquifer median nitrate concentrations of 0.3 mg NO3–N/L will rise to median concentrations of at least 4.7 mg NO3–N/L.”
I doubt it will get to these levels as a circuit breaker will need (have) to be applied before this stage but dairy farmers need to front foot this issue otherwise we will be seeing a wholesale land use change (again) in Canterbury.
The research article also highlights what is being experienced in the EU:
“In Canterbury the amount of nitrate leached to the environment more than doubled from 1990 to 2017 (Ministry for the Environment and Statistics New Zealand 2019). The average for dairy stocking rate for New Zealand in 2017-18 was 2.8 cows per hectares and for Canterbury 3.4 cows per hectare (LIC and DairyNZ 2018). This stocking rate is high compared to the rate of about one dairy cow per ha mandated by the European Union (EU) to protect freshwaters. EU member states are required to guarantee that the annual farm application of nitrogen, as animal manure, does not exceed 170 kg per hectare, equivalent to a stocking rate of one cow per ha (Mateo-Sagasta, Zadeh, and Turral 2018).”
Some thoughts from other sources and regions are;
Marnie Prickett of Choose Clean Water says, “It’s not a big ask to set a nitrate limit under one. Many regional councils already manage nitrate pollution to more stringent levels. Horizons Regional Council is managing to 0.44 mg/L, while Hawkes Bay Regional Council set their limit at 0.8 mg/L”.
“The Ministry for the Environment itself recommended last year that nitrates not be allowed to exceed 1 mg/L, as did the majority of the Science and Technical Advisory Group advising on the Fresh Water Standards.”


